Maps
Provides general definitions of map properties like layers, themes and related concepts.

Describes how maps are characterized.
Defines map layers.
Defines map themes and zoom levels.
Describes how map themes and map source data can be saved separately or together.
Defines a map layer hierarchy and describes how this can be customized.
Describes how to view hidden map layers by configuring and using the See Through Interactor.
Describes the Dynamic Style Setting pane.
Describes the result of splitting or filtering map background layers with examples.
Overview
Whether it contains vectorial or raster data, every map exists as a set of data. In addition to this data set, a map is characterized by a set of properties and a theme. Every map has a theme, and in JViews Maps JViews Map Viewer a theme specifies the layers, zoom levels, and other information that control how the map is viewed at different zoom levels. A theme is the sum of the characteristics of a map.
See
Map themes and zoom levels for more information.
Map layers
A map displays one or more data sources, which describe the map components. A data source provides the map components, such as polygons and lines, and their properties. If you import more than one data source, each is placed into a separate layer that forms part of the map background.
Layers are also used to contain other information, such as grids, labels and measurements. You can control how much information is displayed at any one time by selecting which layers to make visible. See
Map themes and zoom levels for more information.
Most layers allow users to define styling parameters, such as
color,
border thickness, or
labels for the graphical components. You can adjust the order of layers and the transparency of its content so that one layer does not obscure the information in another (see
Managing map layers).
A component is the lowest level of object and can be considered as a polyline with properties such as name and position (used for streets for example), or as an area with properties such as name and color (used for countries for example). Component properties can be used for labeling or filtering and are displayed in the tooltips (if activated on the map), and in the Property pane of the selected layer.
The purpose of layers is to provide a hierarchical organization/decomposition of the map represented using a given style. There is no limit to the number of layers you can define. The contribution that each layer makes to the overall theme is known as a layer style.
For example, a map background layer could consist of ground transportation with roads, motorways, streets, and tunnels defined as sublayers. Or the map background layer could be based on legal boundaries with countries, states, counties, cities, and blocks defined as sublayers.
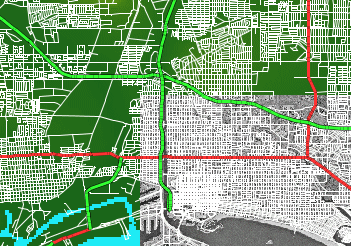
The following figure shows an example of a map showing road, highway, and motorway layers.
A map displaying layers
Layers are displayed in a pane in the Map Builder under the Map Layers tab.
For more information, see
Managing map layers.
Map themes and zoom levels
A map theme is a collection of all layer styles, zoom levels, symbols, and how zooming affects each map configuration. For example, you can specify a set of visual properties in the Map Style Property Sheet, such as whether elements are visible or not, the transparency level, and the color, line thickness, or label for each layer. You can then associate these properties with a selected zoom level and when a zoom operation crosses the zoom threshold, the next style set is applied dynamically. In other words, you can display a style set per scale range, (see
Setting dynamic styles). There is no limit to the number of zoom levels that you can define that trigger a change in the appearance of a map.
For example, in a map of an entire country, the cities could display at a zoom level that shows the whole country. When zooming in, you can see only street and building map layers, and when zooming out only the motorways and cities.
Symbols can also be added to a map and contribute to the overall theme, but this must be done outside of the Map Builder. Symbols are placed in their own layers and can be set to visible or invisible.
For more information about how to add symbols to a map, refer to the JViews Diagrammer document Using the Designer
Saving a map theme with or without map data
You can save the map with data, or save it as a theme only containing references to the raw map data.
Map Theme Only
A theme has basically to do with the look and feel of the map and provides you with full control over how map data is displayed. A map theme allows you to decide what is displayed, when, and how.
If a map is saved as theme only, the application must have access to the map data sources. The following prepared map data is saved:
Uniform Resource Locators (URLs) or file names, pointers to map data sets (server, local directories, databases, …), and any specific parameter relevant to each data source (for example, the features selected or the area of selection within the data source).
The number, name and hierarchy of layers.
The look and feel of each layer (color, transparency, thickness for vector, …).
The resolution collection to which a given map theme will apply (for example, see roads in white, thickness 3 at “street level”, but after a zoom out operation see the same roads in black, thickness 1 at “city level”, then zoom out again to make them disappear).
A use case for this implementation could be as an application used to monitor traffic in a Web portal. The application developed using JViews Maps would load the latest traffic and street information at launch time, from external Map Servers.
For more information about saving a map theme, see
Saving a map.
Map Theme and Map Data
When you save the map theme and the map data, the contents of the map file are the same as when you save a map theme only, but instead of storing map data as a set of URLs or pointers, the data is copied locally. This provides a faster loading time, especially for raster data, and allows a map to be displayed even if the original "source data" is not accessible anymore.
However, some operations on the map such as a change in coordinate system might need this source data to ensure proper reprojection without loss of precision. If source data is not available, embedded map elements are reprojected without reading them back from the original data source.
A use case for this implementation could be if the application developed using JViews Maps is used to monitor the position of firemen in a building. The firemen would probably have poor or no connectivity to a server, so would need map data locally. Any available bandwidth could be used to update the position of the individual firemen in the building during an intervention.
For more information about saving a map theme and map data, see
Saving a map.
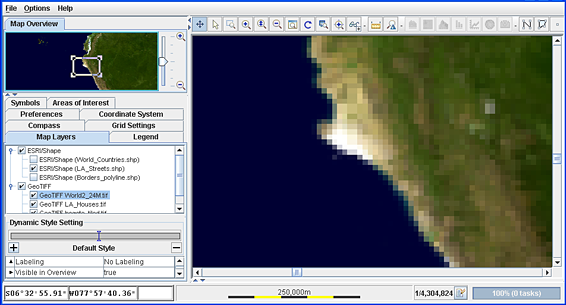
Map layer hierarchy
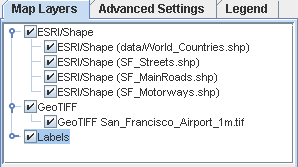
As you import different data source types a layer hierarchy is built up consisting of layers and sublayers. Data sources of the same type are grouped as sublayers of a parent layer.
In the following figure, the ESRI/Shape (see
Shapefile format) and GeoTIFF (see
GeoTIFF format) files are grouped as sublayers under their parent layers. The last layer in the hierarchy becomes the front layer in the Map View pane. For example, the Labels layer is displayed in front of the GeoTIFF layer in the Map View pane.
Standard layer hierarchy
You can rename layers and sublayers to make the name more meaningful, (see
Renaming a map layer). For example, San Francisco Streets would be more meaningful than SF_Streets.shp.
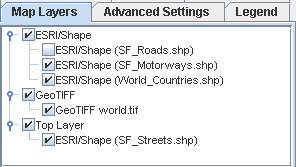
You can also set up your own layer hierarchy by creating new layers and sublayers, (see
Creating a map layer hierarchy). You can then fill them with one or more of the data sources you have already imported.
The following figure shows an example of a new parent layer called Top Layer into which the SF_Streets.shp file has been placed.
Customized layer hierarchy
Map layers can also be hidden from the layer tree, (see
Hiding and showing a map layer in the tree). For example, in a case where users can add more map layers to an application that has a fixed background map, the application developer may want to ensure that the user cannot alter or remove this background map. The solution to this problem is to hide those layers from the tree so that they cannot be modified.
You also have the possibility to move layers to different positions in the hierarchy and to split layers or create filters on layers that contain metadata (see
Splitting or filtering a map layer). You can send layers to the front (top) or back (bottom) of the hierarchy, or change the position of a layer within the hierarchy.
The filtering mechanism allows you to create a layer that displays only the objects that match a filter. You can also split a layer by grouping together the objects that match the same value for selected metadata. In both cases, the split/filtered layers are added to the map layer hierarchy.
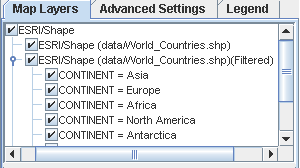
The following figure shows an example of an ESRI/Shape file displayed according to a CONTINENT filter.
Split and filtered map layers
A pop-up menu is available in the Map Layers pane that allows you to carry out most of the operations available in the Map Layers pane. For more information, see
Managing map layers and
Split or filtered map layers.
Viewing hidden map layers
As shown in
Map layer hierarchy, a map is made up using layers of map data. The visibility of layer data is controlled by the map layer order. It is also possible to hide the contents of a layer entirely (see
Hiding and showing a map layer in the tree). The See Through Interactor is used to view the contents of a layer that is not visible in a map.
The following figure shows a map with hidden layers.
A map with hidden layers
To view hidden layer information, you first have to configure the See Through Interactor.
To configure the See Through Interactor:
1. Click the + sign in the bottom right of the See Through Interactor button
1. 
1. . The See Through Tool Configuration window opens.
1. 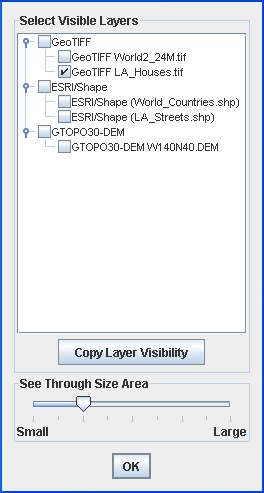
The See Through Tool Configuration window
NOTE The layers selected in the See Through Tool Configuration window follow the map layer hierarchy, that is, higher layers are visible before lower ones.
2. Select the layers to be displayed by the See Through Interactor.
3. Set the visible area using the See Through Size Area slider.
4. Click OK. The See Through Tool Configuration window closes and the See Through Interactor is activated automatically.
5. Click the area in the map where you want to view a sublayer. The sublayer is revealed, as shown in the following figure.
6. 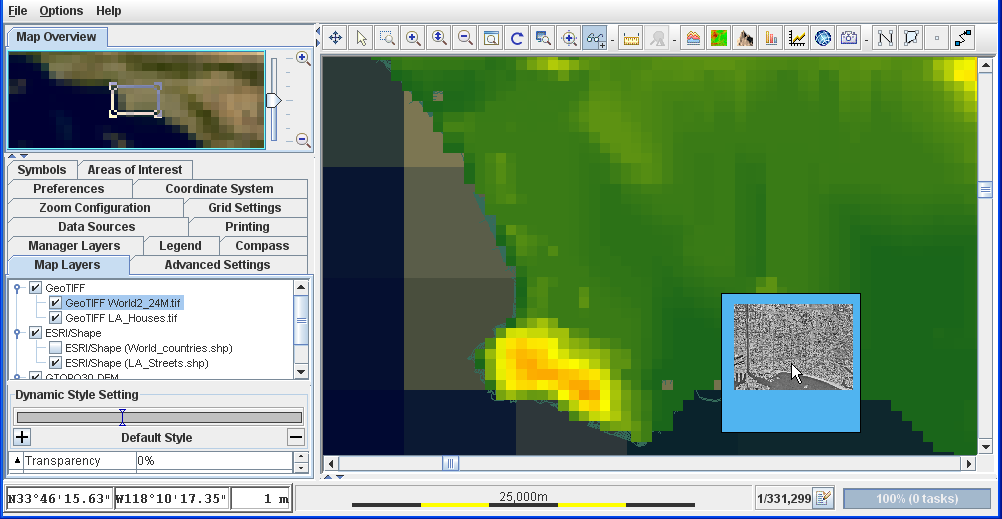
Sublayers in a Map Displayed Using the See Through Interactor
7. Once the see through tool has been configured, click the See Through Interactor button to active the See Through Interactor. You do not need to reconfigure the See Through Interactor each time you use it.
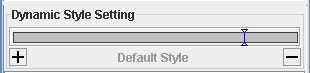
Map Dynamic Styles
The Dynamic Style Setting pane enables you to define a set of dynamic styles for selected zoom levels, for each layer that contributes to the overall theme. The default style displayed in the Dynamic Style Setting pane when you first start the Map Builder has only the basic style set applied and will not change as you zoom in or out.
The following figure shows the Dynamic Style Setting pane. For more information, see
Setting dynamic styles.
The Dynamic Style Setting pane
If you have a multiresolution map, for example, a CADRG, the different resolutions are displayed in the Map Layers pane as sublayers. When a sublayer is selected, a bar is displayed in the Dynamic Style Setting pane, and the name of the style is displayed for each section of the bar. You can also use this bar to set the map scale with a single click. This enables you to preview the map appearance at the selected scale.
Setting the map scale with the Dynamic Style Setting bar
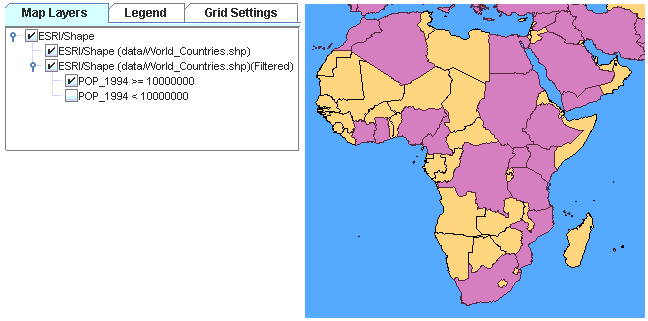
Split or filtered map layers
You can split or filter a map background layer according to the component properties contained within it. Splitting results in two or more filtered layers, whereas filtering produces only a single filtered layer. For example, you could split a layer to create two filtered layers that group together countries with a population above and below a given size, or create a single filtered layer that groups together all countries by name or by continent.
The list of properties displayed depends entirely on the meta data contained in the map layer you have selected and may be different for different layers. You can also split or filter a map layer more than once or you can split or filter an already filtered map layer again. In the case of splitting, an additional option allows you to create a second filtered layer for objects that do not match the filter.
Each time you split a layer into one or more filtered layers, they are automatically added to the Map Layers pane and marked (Filtered).
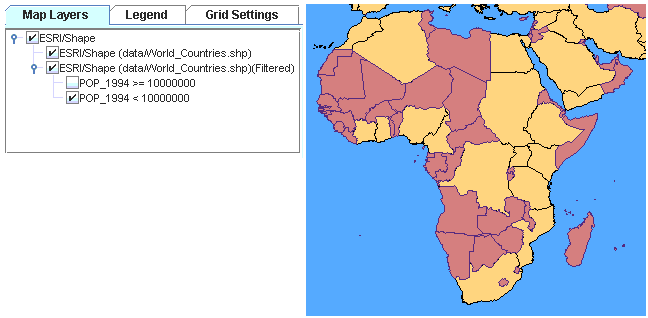
An example of map layer splitting
When you open the Map Builder, the map layer
ESRI/Shape (data/World_Countries.shp) is displayed by default. You can split this map layer, for example, to show the countries in the world that have a population equal to or more than, or less than 10,000,000 people. To do this, you must select the option that creates another filtered layer that groups together the world countries that do
not have a population equal to the value you set (see
Splitting or filtering a map layer). By making the split layers active or inactive, you can display your map in a way that highlights the specific objects you want to filter.
The following figure, centered on Africa, shows countries with a population equal to or more than 10,000,000.
Countries with a population greater than 10,000,000
The next figure shows the result of switching the active and inactive states of the split layers to show the countries that have a population of less than 10,000,000.
Countries with a population less than 10,000,000
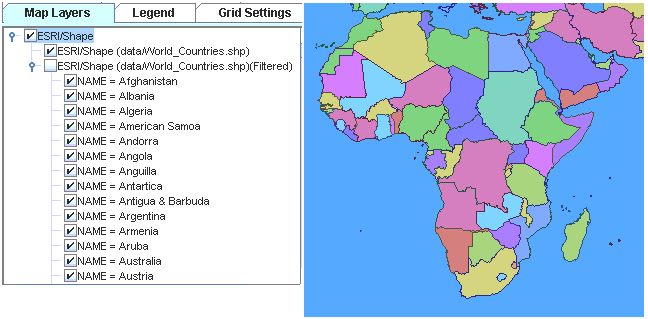
An example of map layer filtering
In the following example, centered on Africa, the Map Layer has been filtered to group together the countries of the world.
An example of map layer filtering
Copyright © 2018, Rogue Wave Software, Inc. All Rights Reserved.