Terrain Analysis
Describes the terrain analysis features provided by JViews Maps for Defense

Provides overview of terrain analysis.
Describes the purpose and use of the Line of Sight feature.
Describes the purpose and use of the terrain cut feature.
Describes the purpose and use of the 3D View feature.
Describes the purpose and use of the Fly Through feature.
Describes the purpose and use of the gradient computation feature.
Describes the purpose and use of the valley computation feature.
Describes the purpose and use of the Area of Sight feature.
Overview
Terrain analysis provides a number of features that enable you to get a better understanding of the terrain on which you want to devise your system of attack or defense. You can use these functions to display color-coded elevation data of what is visible and what is not visible from a given point, to display areas of sight covering 360 degrees about a selected point, and to compute gradient and valley information for selected areas.
In addition, you can create cuts through a terrain that display color-coded elevation data along a polyline, create 3D views and change their display angle and tilt, and simulate the trajectory of ground based or airborne objects.
Lines of Sight
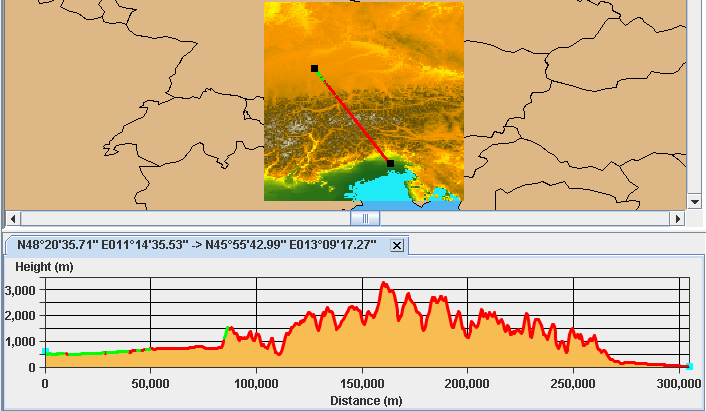
The Line of Sight feature enables you to draw a particular Line of Sight in a map. The line drawn is color-coded according to the elevation of the terrain. The color coding indicates whether a particular point on the line is visible from the point of origin or not. When you draw the line, the corresponding terrain elevation data is automatically displayed in its own pane at the bottom of the Map Builder main window. You can create more than one line of site on the same map.
You can use this information to study different ways of approaching a given target or to set up a particular defense strategy. The coordinates of the line of view are displayed in the pane, which presents distance along the x axis and height along the y axis.
The following figure shows an example of a map with a Line of Sight drawn and the corresponding terrain elevation data displayed.
NOTE This is an example only and the computation is performed using “classic” 3D algorithms. However, if you want to use radar coverage and include weather and fog in computations, you can do so using the API.
Elevation data along a Line of Sight
For more information about Lines of Sight and how to set their properties, see
Creating a Line of Sight.
Terrain cuts
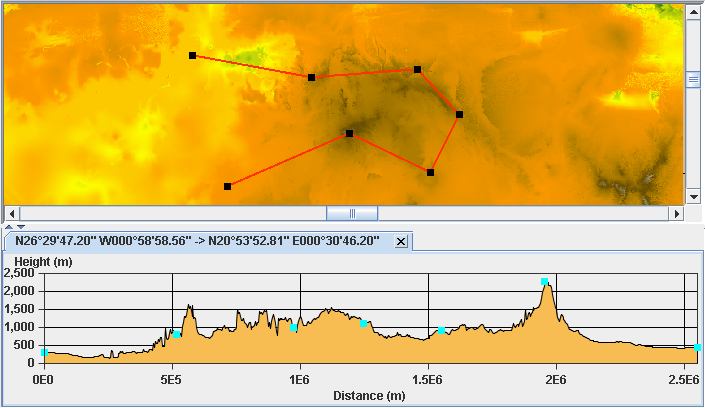
This terrain cut feature of Map Builder enables you to draw a polyline in a map. When you draw the polyline, the corresponding terrain elevation data is automatically displayed in its own pane at the bottom of the Map Builder main window. You can create more than one terrain cut on the same map.
You can use this information to study more complex ways of approaching a given target or to set up a particular defense strategy. This could represent, for example, an attempt at encirclement or a two-pronged attack on a given target. The coordinates of the line of view are displayed in the pane, which presents distance along the x axis and height along the y axis.
The following figure shows an example of a terrain cut with the corresponding elevation data and x,ycoordinates displayed.
Elevation data along a terrain cut
You can select the polyline as a unit and move it on the map, or select one of the nodes and change the shape of the polyline; the terrain elevation data is updated accordingly. You can also add or remove points to or from the polyline using the the CTRL key and a mouse click. The nodes in the elevation data correspond to the nodes in the polyline.
For more information about Terrain Cuts and how to set their properties, see
Creating a Terrain Cut.
3D View
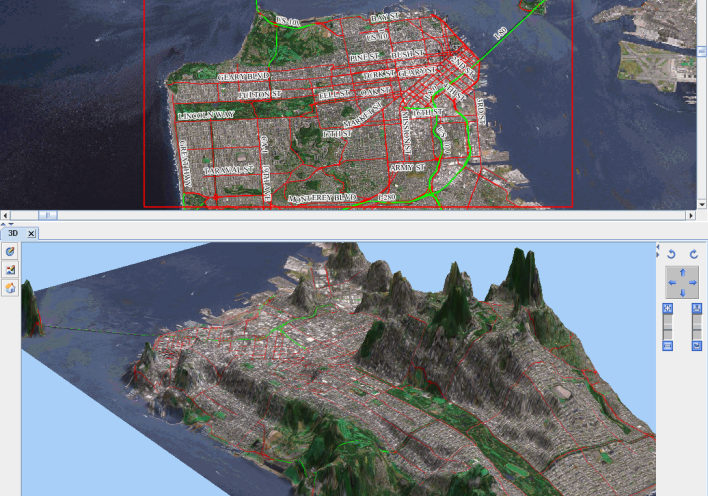
This feature of Map Builder enables you to visualize a map area in 3D to facilitate your understanding of the landscape. When you select a specific area of the map in the Map View, this area is automatically displayed in 3D in its own pane at the bottom of the Map Builder main window. You can create more than one 3D View on the same map. With simple mouse movements or using the interactors on the right, you can easily navigate in the 3D View, zooming in or out or moving left to right.
3D Views can be draped with maps displayed in 2D views and symbols can also be added and displayed.
You can use this information to study the terrain of interest from all angles and tilts and so better determine points of attack or defense by identifying potential hazards in the terrain. You can enlarge the 3D View, make it smaller, move its position in the view, rotate it through 360 degrees, and change the tilt from top to side view in the same operation. You can also use an exaggeration factor to increase or decrease the elevation data display. Visually this is very useful when the distance represented by the 3D View is great and the elevation of the terrain is quite low.
You can also display the 3D View in Wireframe mode, which helps in understanding the geometry, given that areas of light and shadow are not displayed. In addition, a refresh of the display can be set such that it is only carried out when a change takes place in the 3D View, thus reducing the CPU usage.
Symbols (2-dimensional) can be added to a 3D View and managed. For more information, see
Symbols in a 3D View and
Managing Symbols.
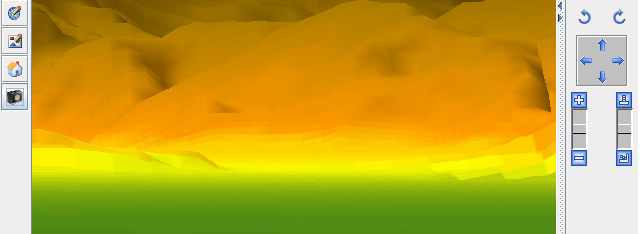
The following figure shows an example of a 3D View.
3D View
For more information about 3D Views and how to set their properties, see
Creating a 3D View.
Fly Through
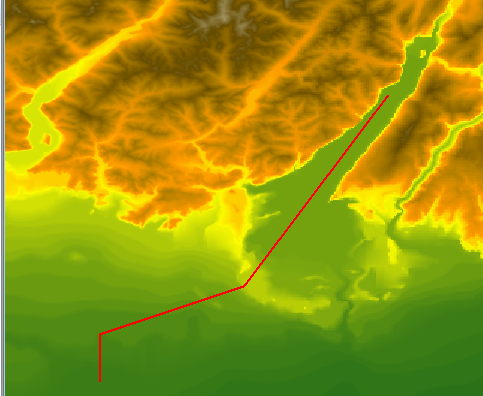
This Fly Through feature enables you to define a path to be followed during the assault on a given target and study, in 3D, the effects that the terrain could have on such an attack. You could, for example, simulate an approach for ground vehicles, foot soldiers, or for fighter planes that fly close to the ground. Or you could create your own scenario using the API. You have full control over the camera placement and the direction in which it is looking.
The API has been designed to specify an altitude for each of the trajectory points and a view point, and can also use a customer-written interpolation method between the points. In addition, you can specify the speed and altitude above ground by changing the style of the map layer containing the Fly Through.
The Fly Through function makes it a simple task to simulate movements in a 3D View.
The operations that you can carry out on the trajectory (polyline) and 3D View are the same as those described in
3D View.
The following figure shows an example of the 2D Fly Through pane.
The 2D Fly Through pane
The following figure shows an example of the 3D Fly Through pane.
The 3D Fly Through pane
For more information about Fly Through paths and how to set their properties, see
Creating a Fly Through.
Gradient computations
The gradient computation feature enables you to compute a color-coded gradient chart that highlights where all the gradients occur in a selected area of terrain. Gradient computations simplify the task of identifying the flat and steep areas. You can change the color model using the Gradient Style Settings window or the Property Sheet. A new Gradient layer is created and displayed in the Map Layers pane each time you carry out a gradient computation.
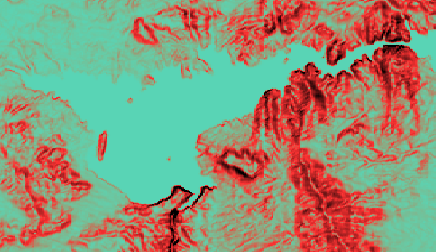
The following figure shows an example of a computed gradient chart.
Gradient Computation
For more information about gradient computations and how to set the gradient properties in the Gradient Style Settings pane, see
Creating a gradient computation.
Valley computations
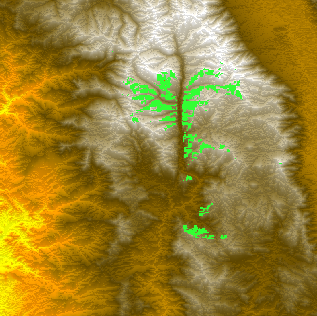
The valley computation feature enables you to compute a color-coded valleys and summits chart that highlights all the peaks and troughs in a selected area of terrain. The valleys and summits, that is the highest and lowest points, are highlighted by the different colors. You can change the color model using the Valley Style Settings window or the Property Sheet. A new Valley layer is created and displayed in the Map Layers pane each time you carry out a valley computation.
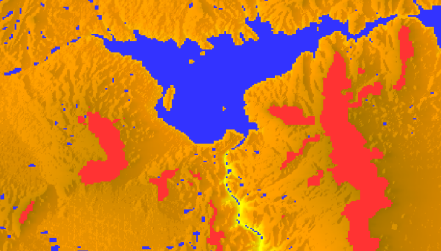
The following figure shows an example of a valley computation.
Valley computation
For more information about valley computations and how to set the valley properties in the Valley Style Settings pane, see
Creating a valley computation.
Areas of Sight
An Area of Sight can be shown as a circular area around the mouse position on the map. The Area of Sight reveals an approximation of the elevation data within the circle and changes as the mouse is moved around the map.
The following figure shows an example of an Area of Sight.
Area of Sight approximation
When you click the mouse button the Area of Sight at this point is saved and the Area of Sight Style Setting window appears for you to set the properties you want. When you have set the properties, a detailed computation of the visible and invisible areas is carried out and displayed in the Map View as a raster image.
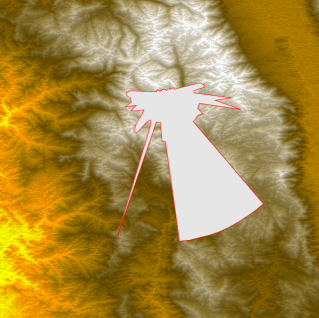
The following figure shows an example of an Area of Sight with detailed computations.
Detailed Area of Sight computation
The point around which the computation is done is displayed in the center of the Area of Sight (you may have to zoom in to see it). A new Area of Sight layer is created and displayed in the Map Layers pane each time you carry out an Area of Sight computation.
You can change the colors used to display the visible and invisible parts of the terrain, increase or decrease the precision of the terrain display, and change the point of view height to view the terrain either at ground level or at a given altitude.
For more information about Area of Sight computations and how to set their properties, see
Creating an area of sight.
Copyright © 2018, Rogue Wave Software, Inc. All Rights Reserved.