Example 2: Representing Time Values
You are now going to represent temperatures that have been recorded every two hours in the morning. The temperatures are in degrees Celsius and are represented by a marked polyline. Let’s suppose you want to represent the time on a circular scale as on a clock. The following table lists the temperatures you are going to display in the chart:
Temperatures Recorded Every Two Hours
Hour | Temperature |
2 | 8 |
4 | 9 |
6 | 11 |
8 | 12 |
10 | 14 |
12 | 15 |
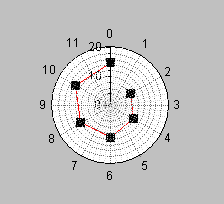
Figure 3.3 shows the chart that you will obtain.
Figure 3.3 Polar Chart Representing Time Values
To build this chart, you will perform the following tasks:
Version 6.0
Copyright © 2015, Rogue Wave Software, Inc. All Rights Reserved.