Creating the Polar Chart
2. Drag a polar chart from the Charts palette to your working buffer.
3. Double-click this object to open its inspector.
See
Using the Chart Inspector for an overview of the Chart inspector. This section contains an explanation of each notebook page you may need to use when working with charts.
4. At this stage, it is a good idea to save the buffer containing your chart.
Make sure you select a directory to which you have write access. Also remember to save periodically as you work.
Defining the Data Set
You are now going to define a data set and enter the time and temperature values listed in
Table 3.1.
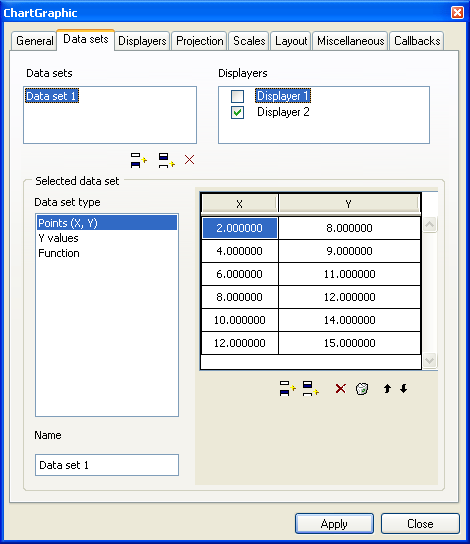
1. Select the Data sets page of the Chart inspector.
The top of this page shows the list of data sets and the list of displayers created for the current chart. At this stage, you can either use a data set that is already defined for the current chart or create another data set by simply clicking the Insert icon

below the Data sets list.
Just remember to delete the data sets that you will not use since we only need one data set for our example. To delete a data set, select the data set and click the Remove icon

below the Data sets list.
2. Make sure the first data set is selected in the Data sets list.
You are going to use this data set to represent the recorded temperatures. The time values will be displayed along the abscissa scale and the temperature values along the ordinate scale.
3. Make sure “Points (X,Y)” is selected in the Data set type list. If not, select “Points (X,Y)” in the Data set type list.
4. Make sure the (X,Y) list in the scrolling list next to the Data set type list is empty. If not, click the Clean icon

below the list to empty it.
You are now going to fill in the data set with the hours and the temperatures from
Table 3.1.
5. Click the Add icon

below the empty (X,Y) list as many times as necessary to create the required number of empty rows.
6. Select the first cell (X cell) of the first row and enter the first time value.
7. Select the second cell (Y cell) of the first row and enter the first temperature value.
8. Repeat steps 6 and 7 for each row.
9. Click Apply to validate the changes.
10. Change the default name of the data set to Morning Temperatures in the Name field.
The Data sets list is updated accordingly.
11. Click Apply to validate the change.
Version 6.0
Copyright © 2015, Rogue Wave Software, Inc. All Rights Reserved.