Marked Polyline Displayer
A marked polyline displayer has the following basic characteristics:
Class | |
Category | Composite |
Number of real data sets displayed | 1 |
Can be used with all types of projections | Yes |
Number of child displayers | 2 (1 scatter displayer + 1 polyline displayer) |
Items drawn | Markers and/or Polyline  |
The marked polyline displayer is composed of a scatter displayer (an instance of the
IlvScatterChartDisplayer class) and a polyline displayer (an instance of the
IlvPolylineChartDisplayer class). Each child displayer can be customized individually. You can specify the palette, the marker type, and the marker size directly for the scatter displayer. You can specify the palette directly for the polyline displayer. Use the following methods to access the child displayers:
The Charts Library also provides some methods at the level of the
IlvMarkedPolylineChartDisplayer class that allow you to set properties defined for child displayers more quickly. The following table lists all the properties that can be set at the level of the
IlvMarkedPolylineChartDisplayer class. (For details on all the properties that can be set on a scatter displayer, see
Scatter Displayer. For details on all the properties that can be set on a polyline displayer, see
Polyline Displayer.)
Property | Methods | Default Value |
General Properties |
Markers Displayed | isMarkerVisible setMarkerVisible | IlvTrue |
Polyline Displayed | isLineVisible setLineVisible | IlvTrue |
Scatter Displayer Properties |
Palette | getMarkerPalette setMarkerPalette | 0 |
Palette Foreground | getMarkerForeground setMarkerForeground | 0 |
Palette Background | getMarkerBackground setMarkerBackground | 0 |
Polyline Displayer Properties |
Palette | getLinePalette setLinePalette | 0 |
Palette Foreground | getLineForeground setLineForeground | 0 |
Palette Background | getLineBackground setLineBackground | 0 |
By default, a marked polyline displayer displays a data set with both markers and a polyline. However, you can specify that only markers are to be displayed by setting the property Polyline Displayed to IlvFalse. You can specify that only a polyline is to be displayed by setting the property Markers Displayed to IlvFalse.
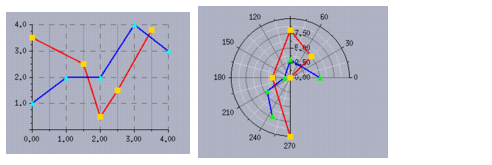
Figure 8.13 illustrates the fact that a marked polyline displayer can be used with all types of projections. Data sets are represented by marked polyline displayers in a Cartesian chart (using a Cartesian projection) and in a polar chart (using a polar projection).
Figure 8.13 Marked Polyline Displayers in a Cartesian Chart and in a Polar Chart
We can use the marked polyline displayer displaying the red lines and gold markers as an example. To create this displayer, we can use the following code:
IlvMarkedPolylineChartDisplayer* displayer = new IlvMarkedPolylineChartDisplayer(); displayer->setMarkerForeground(dpy->getColor("gold")); displayer->setLineForeground(dpy->getColor("red")); |
Version 6.0
Copyright © 2015, Rogue Wave Software, Inc. All Rights Reserved.