Polyline Displayer
A polyline displayer has the following basic characteristics:
Class | |
Category | Single |
Number of real data sets displayed | 1 |
Can be used with all types of projections | Yes |
Items drawn | Polyline  |
The following property is specific to a polyline displayer:
Property | Methods | Default Value |
Projected Points Palette | getProjectedPointsPalette setProjectedPointsPalette | 0 |
By default, any data points that should appear outside of the data display area (if such data points exist) are not drawn. The parts of the polyline extending outside of the data display area are simply clipped by the data display area. The drawing on the left in
Figure 8.3 shows how a polyline can be clipped. The screen points corresponding to the data points to be displayed are represented by black squares. Only the parts of the polyline displayed in bold will appear on the screen.
The data points that should appear outside of the data display area can be projected onto the limits of the data display area if desired. Data points that are outside of the data display area (out-of-bounds data points) are projected only if a horizontal projection and/or a vertical projection of out-of-bounds data points are requested at the level of the chart object that uses the displayer. A horizontal projection can be requested on a chart by the method
IlvChartGraphic::setProjectHorizontally. A vertical projection can be requested on a chart by the method
IlvChartGraphic::setProjectVertically.
The drawing on the right in
Figure 8.3 shows how out-of-bounds data points are handled. The parts of the polyline extending outside of the data display area are projected. Points are added (those shown by white circles) in order to close the polyline that was truncated in the drawing on the left. The polyline then appears to be continuous with the projected parts following the limits of the data display area.
These projected parts are displayed with the palette returned by the IlvPolylineChartDisplayer::getProjectedPointsPalette method.This method returns a pointer to the palette object that has been set to display out-of-bounds data points for the current polyline displayer, if such a palette has been set. Otherwise, it returns a pointer to the palette object that has been set to display out-of-bounds data points in the chart object that uses the current polyline displayer.
Figure 8.3 Out-of-Bounds Data Point Projection
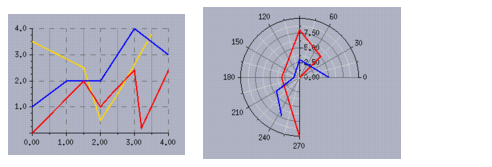
Figure 8.4 illustrates the fact that a polyline displayer can be used with all types of projections. Data sets are represented by polyline displayers in a Cartesian chart (using a Cartesian projection) and in a polar chart (using a polar projection).
Figure 8.4 Polyline Displayers in a Cartesian Chart and in a Polar Chart
We can use the polyline displayer displaying the blue polyline as an example. We can create this displayer by using the following code:
IlvPolylineChartDisplayer* displayer = new IlvPolylineChartDisplayer(); displayer->setForeground(dpy->getColor("blue")); |
Note: The Drawn Filled property has no meaning for the polyline displayer. The polyline is simply drawn with the foreground color of the defined palette. |
Version 6.0
Copyright © 2015, Rogue Wave Software, Inc. All Rights Reserved.