Creating a Simple Cartesian Chart
You are going to see how to create a simple Cartesian chart that is similar to Chart 1 in
Figure 5.6. The data to be represented are the morning and afternoon mean temperatures recorded for each day of a week. The temperatures are expressed in degrees Celsius. The days of the week are referenced by indexes from 0 to 6. The data for the chart are listed in
Table 5.1. You will see the steps required to display these data in a Cartesian chart.
Data for the Example Chart
Day | Morning Mean Temperature (° C) | Afternoon Mean Temperature (° C) |
0 | 10 | 16 |
1 | 8 | 12 |
2 | 12 | 20 |
3 | 15 | 25 |
4 | 14 | 22 |
5 | 14 | 24 |
6 | 13 | 26 |
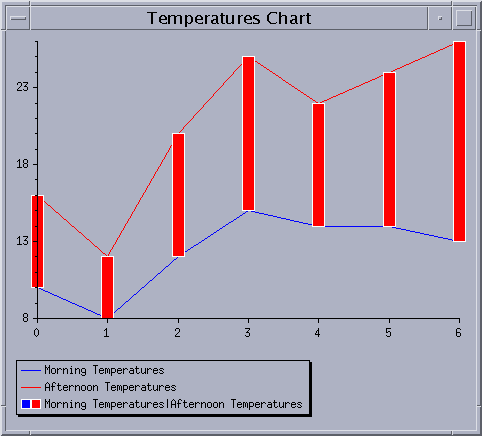
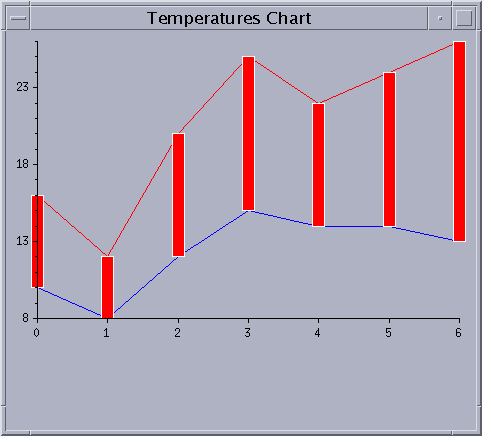
Figure 5.7 shows the Temperatures Chart that will be created to display our data. The morning mean temperatures will be displayed with a blue polyline (the bottom line of the chart) and the afternoon mean temperatures with a red polyline (the top line of the chart). In the chart, we also want to display the two sets of temperatures with high-low bars in order to illustrate the variation between the morning and afternoon temperatures for each day of the week. After the chart is constructed, we will show you how to add the legend that appears at the bottom of the chart.
Figure 5.7 Example Cartesian Chart
The complete source code of this example can be found in the cartesian.cpp file located in the $ILVHOME/samples/charts/userman/src directory.
Creating the Data Sets
1. Create the objects representing the data sets we want to display.
We want to display two data sets on the same chart: the morning mean temperatures and the afternoon mean temperatures for each day of a week. The days will be plotted along the abscissa scale and the temperatures along the ordinate scale. To define each data set, we create a data set that stores data points with two coordinates (x, y).
//== Create two data sets. IlvChartDataSet* dataSets[2]; //== Create one data set to store the morning temperatures. dataSets[0] = new IlvChartPointSet("Morning Temperatures"); //== Create one data set to store the afternoon temperatures. dataSets[1] = new IlvChartPointSet("Afternoon Temperatures"); |
2. Put the data to be displayed into the created data sets.
The day is set as the abscissa and the temperature as the ordinate of the stored data points.
//== Put the data into the morning temperatures data set. dataSets[0]->addPoint(IlvDoublePoint(0, 10)); dataSets[0]->addPoint(IlvDoublePoint(1, 8)); dataSets[0]->addPoint(IlvDoublePoint(2, 12)); dataSets[0]->addPoint(IlvDoublePoint(3, 15)); dataSets[0]->addPoint(IlvDoublePoint(4, 14)); dataSets[0]->addPoint(IlvDoublePoint(5, 14)); dataSets[0]->addPoint(IlvDoublePoint(6, 13)); //== Put the data into the afternoon temperatures data set. dataSets[1]->addPoint(IlvDoublePoint(0, 16)); dataSets[1]->addPoint(IlvDoublePoint(1, 12)); dataSets[1]->addPoint(IlvDoublePoint(2, 20)); dataSets[1]->addPoint(IlvDoublePoint(3, 25)); dataSets[1]->addPoint(IlvDoublePoint(4, 22)); dataSets[1]->addPoint(IlvDoublePoint(5, 24)); dataSets[1]->addPoint(IlvDoublePoint(6, 26)); |
Creating a Cartesian Chart
To create a Cartesian chart, use the following code:
IlvChartGraphic* chart = new IlvCartesianChart(display, IlvRect(10, 10, 450, 300)); |
The IlvRect object passed as a parameter specifies the bounding box of the created chart.
Adding the Data Sets to the Chart Data Object
The data sets are added to the chart data object set on the chart object. The chart data object is obtained for a given chart using the
IlvChartGraphic::getData method.
IlUInt dataSetsCount = 2; chart->getData()->setDataSets(dataSetsCount, dataSets); |
Creating and Adding the Displayers
1. Create and add the objects used to display the graphical representations of the data.
We want to display the two sets of temperatures with two polylines and also with a high-low bar representation. The first polyline represents the morning mean temperatures data set and corresponds to dataSets[0]. The second polyline represents the afternoon mean temperatures data set which corresponds to dataSets[1]. The high-low bar representation represents both the morning and afternoon mean temperatures data sets.
//== Create and add the displayers. chart->addDisplayer(new IlvPolylineChartDisplayer(),dataSets[0]); chart->addDisplayer(new IlvPolylineChartDisplayer(),dataSets[1]); IlvPalette* risePalette = display->getPalette(display->getColor("red"), display->getColor("white")); IlvPalette* fallPalette = display->getPalette(display->getColor("blue"), display->getColor("white")); chart->addDisplayer(new IlvHiLoBarChartDisplayer(12, risePalette, fallPalette), dataSetsCount, dataSets); |
The first parameter of the constructor of the
IlvHiLoBarChartDisplayer object, that is,
12 is the width of the bars. The
risePalette is used to draw the high-low items for which the corresponding low value (that is, the morning mean temperature) is smaller than the high value (that is, the afternoon mean temperature). The
fallPalette is used to draw the high-low items for which the corresponding low value is greater than the high value.
2. Set the colors for the polyline displayers.
We want the morning mean temperatures to be displayed in blue and the afternoon mean temperatures in red.
chart->getDisplayer(0)->setForeground(display->getColor("blue")); chart->getDisplayer(1)->setForeground(display->getColor("red")); |
Note: The corresponding palettes could have been passed directly as a parameter to the constructors of the polyline displayers as has been done for the high-low bar displayer. |
We have now completed the basic steps for creating a chart. Additional steps can be performed to enhance the appearance of a chart. You are now going to see how to customize the abscissa and ordinate scales and how to add a legend to a chart.
Customizing the Abscissa Scale
We are now going to set the number of steps and substeps displayed on the abscissa scale. The steps are marked by major tick marks on the scale and the substeps are marked by minor tick marks that are drawn between the major tick marks.
The abscissa scale represents the days of the week. Since the number of days in a week is seven, the number of steps should be set to 7 so that one major tick mark appears for each day of the week. We do not want any minor tick marks between the major tick marks so we will set the number of substeps between two steps to 0.
The computation of the steps and substeps for a given scale is performed by a dedicated object called scale steps updater that is set on the scale. Since we want steps and substeps with a constant spacing, we first set a constant scale steps updater on the scale.
IlvSingleScaleDisplayer* abscissaScale = chart->getAbscissaScale(); |
IlvConstantScaleStepsUpdater* updater = new IlvConstantScaleStepsUpdater(abscissaScale); delete IlvScaleStepsUpdater::Set(abscissaScale, updater); |
Then we set on the scale steps updater the number of steps and substeps between two steps.
updater->fixStepsCount(7, 0); |
Customizing the Ordinate Scale
We are now going to set the step and the substep units for the ordinate scale. Again, the steps will be marked with a major tick mark and the substeps with a minor tick mark.
The ordinate scale represents the temperature in degrees Celsius. We want a major tick mark to appear every five degrees, and a minor tick mark every degree. To do this, we specify 5 as the step unit and 1 as the substep unit.
Since we want steps and substeps with a constant spacing, we first set a constant scale steps updater on the scale.
IlvSingleScaleDisplayer* ordinateScale = chart->getOrdinateSingleScale(); |
updater = new IlvConstantScaleStepsUpdater(ordinateScale); delete IlvScaleStepsUpdater::Set(ordinateScale, updater); |
Then we set on the scale steps updater the step and the substep units.
updater->fixStepUnit(5, 1); |
The Temperatures Chart now appears as shown in
Figure 5.8.
Figure 5.8 The Temperatures Chart
Adding a Legend
To add a legend to a chart, perform the following steps:
1. Create a chart legend object.
IlvChartLegend* legend = new IlvChartLegend(display, IlvRect(10, 330, 450, 50)); |
The chart legend object is a graphic object that is positioned independently of the chart. The IlvRect object passed as a parameter to the constructor gives the position and the default size of the legend. The created legend does not contain any legend items since it is not yet connected to a chart. A legend must be connected to a chart to have the legend items appear.
2. Connect the legend to the chart.
chart->setLegend(legend); |
When the legend is set on the chart, the legend items corresponding to the displayers that are defined in the chart are automatically computed and the size of the legend is recomputed to fit these legend items.
Note: The chart legend object is a graphic object like the chart object and is positioned independently of the chart object. Just as you add the chart object to a container or manager, you must also add the chart legend object to the container or manager. Otherwise, the chart legend object will not appear on the screen. |
Now, with the legend added, the Temperatures Chart appears as follows:
Figure 5.9 The Temperatures Chart with a Legend
Version 6.0
Copyright © 2015, Rogue Wave Software, Inc. All Rights Reserved.


