
This section covers the ways in which the appearance of the data objects drawn on the display area can be changed. Depending on the graph type, data values are represented by bars, lines, wigets (polygonal shapes), areas, or pie wedges. For each of these objects, the style and color of its frame, the style and color of its interior, and even its shape can be specified.
Of course, not all styles are applicable to every type of object. For example, lines do not have interiors.
For most graph types, the appearance of the data items is controlled by the SRGraphStyle member of the individual data objects. If more than one data object is associated with a single item on screen (e.g. XY Scatter, HiLo_OpenClose, Gantt, etc.), the style of the first data object or the data objects in the first group is used. Using individual styles provides maximum flexibility. For example, a data watcher (Chapter 23, "Data Tagging System") an highlight out-of-range data items by simply changing their style settings.
The only graph types that do not use the style of the individual data objects are those that combine the individual points to form a polygon that represents the whole group. Area and Strata charts are examples. These charts generally use the style member in the SRGraphDataList objects (the groups).
By default, the style settings for an SRGraphData or derived object are CX_XXX_AUTOMATIC. This means that the data is displayed in a manner appropriate for the graph type. The wiget shape, line style, and fill color for each group of data items are selected automatically using a preset order of rotation (see "How Automatic Colors, Fills, and Wigets Are Chosen" below).
To change this behavior, you must select a different style setting.
The style of a line or the outline of a bar or wiget can be changed by calling SRGraphStyle::SetFrameStyle() with one of the following frame styles.
| Frame style | Description |
| CX_FRAME_NONE | If the object has a frame or draws a line then it will be omitted. |
| CX_FRAME_AUTOMATIC | The frame will be chosen for you. |
| CX_FRAME_LINE | The frame is a simple line. |
| CX_FRAME_PATTERN | A pattern is used to paint a frame. Use SRGraphStyle::SetFramePattern() to specify a bitmap resource. |
| CX_FRAME_COLOR | A simple line is drawn using the frame thickness as defined by SRGraphStyle::SetFrameWidth() in the color defined by SRGraphStyle::SetFrameColor(). |
| CX_FRAME_DASH | The frame is a dashed line. |
| CX_FRAME_DOT | The frame is a dotted line. |
| CX_FRAME_DASHDOT | The frame is a line of alternating dashes and dots. |
| CX_FRAME_DASHDOTDOT | The frame is a line of alternating dashes and two dots. |
| CX_FRAME_USER | User defined – override GetCustomPenStyle() |
The width and color of the lines or frames can be specified with SRGraphStyle::SetFrameWidth() and SetFrameColor().
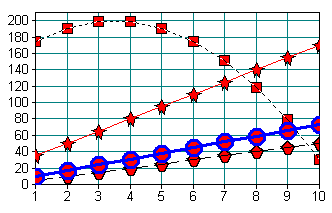
The code segment below and Figure 113 illustrate several of these line styles.
SRGraphStyle* pS = m_Graph.GetSafeData(0,0)->GetStyle(); pS->SetFrameStyle(CX_FRAME_LINE); m_Graph.SetGlobalStyle(0,0,-1,-1,pS); pS = m_Graph.GetSafeData(0,1)->GetStyle(); pS=>SetFrameStyle(CX_FRAME_DASH); m_Graph.SetGlobalStyle(1,1,-1,-1,pS); pS = m_Graph.GetSafeData(0,2)->GetStyle(); pS->SetFrameStyle(CX_FRAME_DOT); m_Graph.SetGlobalStyle(2,2,-1,-1,pS); pS = m_Graph.GetSafeData(0,3)->GetStyle(); pS->SetFrameStyle(CX_FRAME_COLOR); pS->SetFrameWidth(3); pS->SetFrameColor(CXCLR_BLUE); m_Graph.SetGlobalStyle(3,3,-1,-1,pS); |
The interior appearance is controlled by SRGraphStyle::SetInteriorStyle(). The following interior styles are available. The SRGraphStyle::SetColor(COLORREF clr) and SetColor(COLORREF a, COLORREF b) functions select the colors used for solid color fills and gradient fills (shades), respectively.
| Interior style | Description |
| CX_INTERIOR_NONE | The interior is transparent. |
| CX_INTERIOR_AUTOMATIC | An interior is chosen automatically. |
| CX_INTERIOR_COLOR | A solid fill color determined by SRGraphStyle::SetColor() is used. |
| CX_INTERIOR_VSHADE | A vertical shade is used. The range of colors is determined by SRGraphStyle::SetColor(a, b). |
| CX_INTERIOR_HSHADE | A horizontal shade is used. |
| CX_INTERIOR_ASHADE | An angled shade is displayed at an angle specified by SRGraphStyle::SetAngle(). |
| CX_INTERIOR_RESOURCE | The interior is filled or tiled with a bitmap from the resources. The name of the resource is set by SRGraphStyle::SetResourceName(). Tiling or stretching is controlled by SRGraphStyle::SetStretchMode(); |
| CX_INTERIOR_IMAGE | The interior is filled with an image from a bitmap (.bmp) or .jpeg file. This style also uses SetResourceName() and SetStretchMode(). |
| CX_INTERIOR_PATTERN | Not currently used (reserved). |
| CX_INTERIOR_USER | User defined – override DrawCustomRgnFill(). |
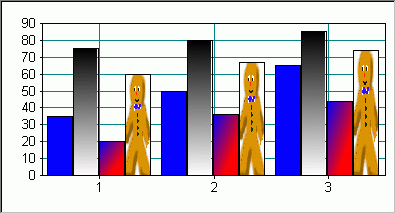
The code segment below and Figure 114 demonstrate the use of several of these fill styles.
SRGraphStyle* pS;
for(int x=0;x<3;x++)
{
    m_Graph.SetValue(x,0, 35+15*x);
    m_Graph.SetValue(x,1,75.+5.*x);
    m_Graph.SetValue(x,2,20.+20.*x-4*x*x);
    m_Graph.SetValue(x,3,60+7*x);
    pS = m_Graph.GetSafeData(x,0)->GetStyle();
    pS->SetInteriorStyle(CX_INTERIOR_COLOR);
    pS->SetColor(CXCLR_BLUE);
    pS = m_Graph.GetSafeData(x,1)->GetStyle();
    pS->SetInteriorStyle(CX_INTERIOR_VSHADE);
    pS->SetColor(CXCLR_BLACK, CXCLR_WHITE);
    pS = m_Graph.GetSafeData(x,2)->GetStyle();
    pS->SetInteriorStyle(CX_INTERIOR_ASHADE);
    pS->SetColor(CXCLR_BLUE, CXCLR_RED);
    pS->SetAngle(45.);
    pS=m_Graph.GetSafeData(x,3)->GetStyle();
    pS->SetInteriorStyle(CX_INTERIOR_RESOURCE);
    pS->SetResourceName(_T("gbm"));
    pS->SetStretchMode(TRUE);
}
|
Several graph types allow the data to be represented in more than one way. The following object types are available for selection by SRGraphStyle::SetObjectStyle().
The only chart type that allows the full range of these object types is CX_GRAPH_FREESTYLE. Other chart types may ignore some settings if they are not appropriate for the chart type. Check the source code — SRGraphDisplay::DrawXXXData() functions — to see which object types are supported for each graph type.
| Object style | Description |
| CX_OBJECT_NONE | Nothing is displayed unless this type is not allowed in which case the CX_OBJECT_AUTOMATIC style is assumed. |
| CX_OBJECT_AUTOMATIC | The default. An object is used in context with the chart type. |
| CX_OBJECT_POINT | A wiget is drawn. |
| CX_OBJECT_EXPOINT | Uses a line with a terminating wiget. |
| CX_OBJECT_LINE | A simple line is used; the thickness and color are chosen in accordance with the frame style settings. |
| CX_OBJECT_BAR | A rectangular bar is drawn. |
| CX_OBJECT_EXBAR | A bar with pseudo 3D depth is drawn. The depth is set by SRGraphStyle::SetMaxObjectDepth() and activated by SetUseMaxSize(TRUE). |
| CX_OBJECT_BUBBLE | A circular bubble is drawn. |
| CX_OBJECT_ROD | Not currently used (reserved). |
| CX_OBJECT_AREA | Not currently used (reserved). |
| CX_OBJECT_SLICE | Not currently used (reserved). |
| CX_OBJECT_POLYGON | The object is drawn as a polygon. The named polygon resource must be stored in the application resources. |
| CX_OBJECT_EXLINE | Similar to the EXBAR option. This displays a pseudo 3D line with depth. |
| CX_OBJECT_DOT | The object is a tiny circle with lines. |
| CX_OBJECT_SQUARE | The object is a square with lines. |
| CX_OBJECT_TRIANGLE | The object is a triangle with lines. |
| CX_OBJECT_INVERT_TRIANGLE | The object is a downward pointing triangle with lines. |
| CX_OBJECT_DIAMOND | The object is a diamond with lines. |
| CX_OBJECT_BUBBLE | The object is a bubble for bubble charts. |
| CX_OBJECT_VECTOR | The object is an arrow for vector charts. |
| CX_OBJECT_VSTICK | The object is used for vertical "stick" bars. |
| CX_OBJECT_HSTICK | The object is used for horizontal "stick" bars. |
| CX_OBJECT_USER | User defined — override DrawCustomPointObject(). |
The dot objects (CX_OBJECT_DOT, CX_OBJECT_SQUARE, and CX_OBJECT_TRIANGLE) are normally drawn with connecting lines. To turn off the lines connecting 'dot' objects, call SRGraphStyle->SetFrameStyle(CX_FRAME_NONE).
The size, shape, and appearance of the wigets used in Line, Scatter, and other graphs can be modified by functions of the style member of the individual data items. This is illustrated in the following code segment:
SRGraphStyle* pStyle = m_Graph.GetSafeData(i,g)-> GetStyle();
pStyle->SetObjectStyle(CX_OBJECT_EXPOINT);
pStyle->SetObjectName("CIRCLE");          // wiget name
pStyle->SetInteriorStyle(CX_INTERIOR_COLOR);
pStyle->SetColor(CXCLR_RED);
pStyle->SetUseMaxSize(TRUE);              // change wiget size
pStyle->SetMaxObjectHeight(2);            // 2*10 = 20 pixels high
pStyle->SetMaxObjectWidth(1.5);           // 15 pixels wide
|
For wigets, the parameter for SetMaxObjectHeight() and SetMaxObjectWidth() is such that a value of 1 gives a wiget 10 pixels high or wide.
For dot objects, SetMaxObjectWidth() specifies the radius in pixels.
Wiget shapes are defined in simple text files (*.ply), so it is easy to define new wigets and add them to the project's resources. By default, the wigets are used in the order that they appear in SRGRes.rc — star, hex, square, circle, diamond, cross, plus, and triangle. If you want to override the default order, call SetObjectStyle() and SetObjectName(), as shown above, to select a particular wiget.
To create a custom wiget shape:
Layout your shape and determine the coordinates of the vertices in pixels.
Create a text file with a ".ply" extension. A number in the first line specifies the number of vertices. The remaining lines list the x and y coordinates of a vertex, separated by a space. The first vertex is repeated to close the polygon. For example, the text file below, from hexx.ply, defines a shape with six regular sides.
74 6.98 04 –6.9-4 –6.9-8 0-4 6.94 6.9 |
Edit the project's resource file and add a line adding the .ply file to the "WIGETS" section of the resources.
HEXX WIGETS DISCARDABLE "res\\hexx.ply" |
In your chart setup code, use SRGraphStyle::SetObjectName() to select your custom shape for individual data objects.
SRGraphStyle* pStyle=m_Graph.GetSafeData(i,g)->GetStyle();
pStyle->SetObjectStyle(CX_OBJECT_EXPOINT);
pStyle->SetObjectName("HEXX");
|
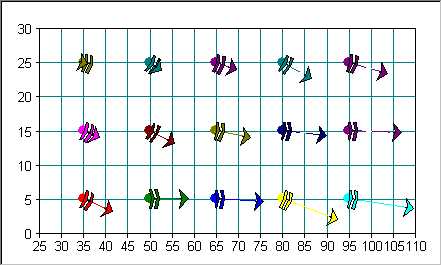
In Vector graphs, both ends of the line segment can be displayed using polygonal shapes. Like wigets, the appearance of the line ends is controlled by SRGraphStyle::SetObjectName(). For vectors, the resource names of the tail and head shapes are specified together, separated by a "|" character. For example,
m_Graph.GetSafeData(x, g)->GetStyle()-> SetObjectName(_T("TAILA|ARROWA"));
|
Currently, only three shapes are supplied as LINE_ENDS resources — TAILA, ARROWA, and ENDBLOB. Like wigets, these shapes are defined in simple text files (*.ply), so it is easy to add new shapes to the resources.
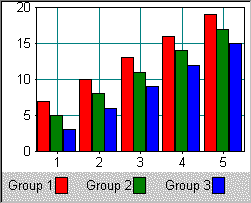
In bar graphs of all types, the appearance of the bars is controlled by the style member of the individual data objects.
The following code uses the styles listed above to draw the bars for group 0 with blue interiors and yellow frames.
CString s;
for(int x=0;x<nPoints;x++)
{
    m_Graph.SetValue(x,0,20+1*x);
    s.Format("%d", x);
    m_Graph.GetSafeData(x,0)->SetAnnotation(s);
    m_Graph.GetSafeData(x,0)->GetStyle()-> SetFrameStyle(CX_FRAME_COLOR);
                    // frame color
    m_Graph.GetSafeData(x,0)->GetStyle()-> SetFrameColor(RGB(192,192,0));
                   // yellow
    m_Graph.GetSafeData(x,0)->GetStyle()-> SetInteriorStyle(CX_INTERIOR_COLOR);
            // fill color
            // blue
 m_Graph.GetSafeData(x,0)->GetStyle()-> SetColor(CXCLR_BLUE);
 }
|
For bar graphs (including Stacked, Strata, Candle, and Gantt graphs), the style from the group (SRGraphDataList object) is used if the style of the data object is CX_FRAME_NONE and CX_INTERIOR_NONE.
Therefore, the code below gives the same result as the example above by setting the style of the groups and calling SetGlobalStyle() for all the data items.
SRGraphStyle* pStyle=m_Graph.GetGroup(nGroup)->GetStyle(); pStyle->SetInteriorStyle(CX_INTERIOR_COLOR); // fill color pStyle->SetColor(CXCLR_BLUE); // blue pStyle->SetFrameStyle(CX_FRAME_COLOR); // frame color pStyle->SetFrameColor(CXCLR_YELLOW); // yellow // set all data objects to use their group's style SRGraphStyle* pStyle=m_Graph.GetSafeData(0,0)-> GetStyle(); pStyle->SetFrameStyle(CX_FRAME_NONE); pStyle->SetInteriorStyle(CX_INTERIOR_NONE); m_Graph.SetGlobalStyle(-1.-1,-1,-1,pStyle,0); |
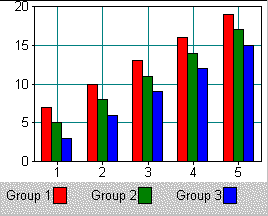
By default, Objective Chart calculates the width of bars to fill the data display area with a small gap between groups. (Figure 116 shows the normal bar spacing.) As shown in Figure 117, you can specify a maximum bar width to make the bars smaller than the default width and increase the spacing between groups.
To specify a maximum bar width:
Get the style member of the display component.
Call SRGraphStyle::SetUseMaxSize(TRUE).
Call SRGraphStyle::SetMaxObjectWidth(nWidth) to set the width in pixels.
For example,
SRGraphDisplay* pD=new SRGraphDisplay; SRGraphStyle* pS=pD->GetStyle(); pS->SetUseMaxSize(TRUE); pS->SetMaxObjectWidth(10); |
Similarly, you can set the depth of the pseudo-3D bars used in EX_VBAR or EX_HBAR graphs or standard bar charts with ISO_CLASSIC axes. Call SetUseMaxSize(TRUE) and SetMaxObjectDepth(nDepth). The default depth is 10 pixels.
Pie wedge labels display the data value and percentage of the total by default. A variety of other choices are available. The trick is to set the label style for each data item. In the loop in which the data are added to the graph, set the annotations and the desired label style. For example,
m_Graph.GetGroup(g)->GetIndex(x)->GetStyle()-> SetLabelStyle(CX_LABEL_TEXT); |
The various label style choices are described below:
| Wedge label style | Description |
| CX_LABEL_NONE | No labels |
| CX_LABEL_AUTOMATIC | Dynamic labels uses an appropriate label style from one of the label styles below. |
| CX_LABEL_VALUE | Data value |
| CX_LABEL_PERCENT | Data value as % of total |
| CX_LABEL_TEXT | Data object's annotation |
| CX_LABEL_VALUE_PERCENT | Combination of above |
| CX_LABEL_TEXT_VALUE | |
| CX_LABEL_TEXT_PERCENT | |
| CX_LABEL_TEXT_VALUE_PERCENT |
To explode a pie wedge from the pie:
Call SetHighlight() on the style member of the data object:
m_Graph.GetSafeData(index,group)->GetStyle()-> SetHighlight(CX_HIGHLIGHT_MEDIUM); |
The highlight styles explode the wedge from the pie. CX_HIGHLIGHT_SMALL, CX_HIGHLIGHT_MEDIUM or CX_HIGHLIGHT_AUTOMATIC, and CX_HIGHLIGHT_LARGE displace the wedge by 15%, 20%, and 30% of the pie's radius, respectively.
To place wedge labels inside of pie (instead of surrounding it), call SetObjectInsideView(TRUE) on the display's style.
pDisplay->GetStyle()->SetObjectInsideView(TRUE); |
To hide the labels of small wedges, specify a size limit using SetUseMaxScale(TRUE) and SetMinRangeX(). Data values (wedges) smaller than this limit are not labeled. The limit can be an absolute value or a percentage of the total of values in the pie. Negative values between 0 and -100 are interpreted as percentages.
pS->SetUseMaxScale(TRUE); pD->SetMinRangeX(600.); // don't label wedges less than 600 |
or
pD->SetMinRangeX(-10.);  // don't label wedges that are less than
                         // 10% of total
|
Often, you want to apply the same combination of style settings to a block of data objects. For example, you generally want all the data items in a group to have the same appearance. This can be accomplished with the SRGraph::SetGlobalStyle() function.
To copy a style to the rest of group g:
SRGraphStyle* pStyle=m_Graph.GetSafeData(i,g)->GetStyle();
pStyle->SetObjectStyle(CX_OBJECT_EXPOINT);
pStyle->SetObjectName("HEXX");
m_Graph.SetGlobalStyle(g, g,-1,-1, pStyle).
|
The SRGraph class contains a style member named m_DefaultDataStyle which can be accessed by SRGraph:: SetDefaultDataStyle() and GetDefaultDataStyle().
In addition, SRGraph::SetValue() has an optional third parameter, a boolean named bUseDefaultStyle which is FALSE by default. If bUseDefaultStyle is TRUE, the style in m_DefaultDataStyle is copied to the style member of the referenced data item. This provides an alternate way to set global styles for data objects.
To use the default data style:
Create an SRGraphStyle object and give it the desired settings.
Copy this style to SRGraph::m_DefaultDataStyle using SetDefaultDataStyle().
Set the bUseDefaultStyle parameter to TRUE when assigning data values with SetValue(). For example,
    SRGraphStyle defStyle;
    defStyle.SetType(CX_TYPE_OBJECT);
    defStyle.SetObjectStyle(CX_OBJECT_SQUARE);
    defStyle.SetUseMaxSize(TRUE);
    defStyle.SetMaxObjectHeight(3);
    defStyle.SetMaxObjectWidth(3);
    defStyle.SetInteriorStyle(CX_INTERIOR_COLOR);
    defStyle.SetColor(CXCLR_BLUE);
    m_Graph.SetDefaultDataStyle(defStyle);
    // tiny blue squares for group 0
    for(int x=0;x<6;x++)
    {
      m_Graph.SetValue(x,0, 15+5*x, TRUE);
    }
    defStyle.SetObjectStyle(CX_OBJECT_DOT);
    defStyle.SetColor(CXCLR_RED);
    m_Graph.SetDefaultDataStyle(defStyle);
    // tiny red circles for group 1
    for( x=0; x<6; x++)
    {
      m_Graph.SetValue(x,1,95.-4*x, TRUE);
    }
|
Data objects with the default setting for the interior and frame styles, CX_xxxx_AUTOMATIC, are drawn using preset styles. The order in which default colors, line styles, and hatch patterns are used is determined by arrays defined at the top of SRGComp.cpp. Wiget shapes are used in the order their names are listed in SRGres.rc under IDS_SRG_WIGETNAMES. You can reorder the items in these lists to change the order in which the styles are used.
The member variable m_nCurrentIndex of SRGraphComponent is used to select a color or wiget shape from the lists of default values. The SRGraphDisplay routines that draw specific chart types set this variable according to their needs. For example, DrawVBarData() sets m_nCurrentIndex to the group number (relative to the scope) of the current data item. The bars for a group look the same.
You can change this behavior by creating your own class derived from SRGraphDisplay and overriding the particular draw function. For example, perhaps you need the style to be determined by the index of the data item instead of the group. Create a new class based on SRGraphDisplay and copy DrawVBarData() from SRGComp.cpp.
Change the line that reads
m_nCurrentIndex = (CurrentSet + m_nMinSet); |
to
m_nCurrentIndex = (x + m_nMinDiv); |
The bars with the same index will look alike.
Copyright © Rogue Wave Software, Inc. All Rights Reserved.
The Rogue Wave name and logo, and Stingray, are registered trademarks of Rogue Wave Software. All other trademarks are the property of their respective owners.
Provide feedback to Rogue Wave about its documentation.