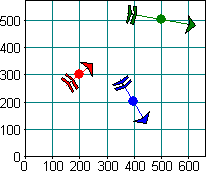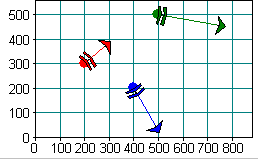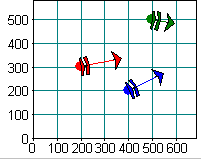

Vector charts are an extension of Bubble charts. They utilize four variables (groups) to draw arrows of specified magnitude and direction at given x-y positions. The first two groups define the x and y coordinates, the third group is the direction of the vector in degrees from the vertical increasing clockwise, and the fourth group sets the vector magnitude.
The scaling options discussed above for bubble charts also apply for the vector magnitude. Note that, under the default scaling, the angle may be distorted if the x and y scaling factors are different.
The appearance of the vector's head and tail can be selected from a variety of styles using SetObjectName(). By default, the anchor point of the vector (tail or midpoint) is marked by a wiget. To change this behavior, call SetObjectStyle() for the individual data items— CX_OBJECT_DOT or CX_OBJECT_NONE are recommended styles. See Section 7.11.5, "Modifying Line Ends," for details.
A vector's position can be changed by dragging its anchor point. The length and direction of the vector can be changed by dragging its head.
The following types of vector graphs are available:
Vector-Centered Graph
Vector-End Graph
Vector-Offset Graph

In this Vector graph, the center (midpoint) of the vector is located at the specified x-y position.
Scatter Axis. Four groups per series.

In this Vector graph, the tail end of the vector is located at the specified x-y position.
Scatter Axis. Four groups per series.

This Vector graph uses a different data format: x, y, ![]() x,
x, ![]() y. The first two groups specify the x-y coordinates of the vector's tail end, and the third and fourth groups specify the position of the vector's head relative to the tail.
y. The first two groups specify the x-y coordinates of the vector's tail end, and the third and fourth groups specify the position of the vector's head relative to the tail.
With this data format, the vector uses the axis scaling by definition. Therefore, SetUseMaxSize(TRUE) has no effect on this type.
Scatter Axis. Four groups per series.
Copyright © Rogue Wave Software, Inc. All Rights Reserved.
The Rogue Wave name and logo, and Stingray, are registered trademarks of Rogue Wave Software. All other trademarks are the property of their respective owners.
Provide feedback to Rogue Wave about its documentation.