
Several classes are used to create and store labels for various axis types. The position of these axis labels also determines the location of tick marks and grid lines.
The axis drawing classes are described in the following sections.
SRGraphLabel extensively modifies the component panel drawing system to allow a rectangular panel, with a shadow and a border, to be rotated to any angle. Its text is also displayed on an angle.
This class is a kind of super label. It holds a list of SRGraphLabel objects and arranges them along a line between two points. SRGraphLabelBlock also performs calculations that either remove or move labels to prevent one from overlapping another. This collision avoidance system may neatly arrange labels in staggered formations. It can rotate whole label blocks so that all the labels remain perpendicular to the axis line at all times.
The label block class also fills a list of points with the positions of the labels. This list of CPoint objects can be used to accurately place tick marks or grid lines next to an axis without recalculating the spacing.
Based upon the SRGraphLabelBlock which stores a list of labels and their positions, the scale classes add the functionality to generate the labels. Each scale class supports a specific axis type or scaling.
The decimal scale automatically fills a series of labels with the best possible decimal numerals for a given font size, numerical range, and distance between end points. SRGDecimalScale is used for all linear, numeric axes.
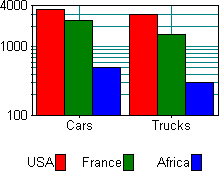
Similar to the decimal scale, the logarithmic scale fills a label block with labels denoting powers of ten and dummy labels that are used to position the ever decreasingly spaced grid lines in logarithmic scales. Logarithmic axes are not limited to full decades. Figure 8 shows a logarithmic scale in action.

Based upon the SRGDecimalScale class, SRGDateScale uses COleDateTime functions to display a chart axis with formatted times, dates, or both. Because COleDateTime uses a double as its basic storage unit, the standard SRGraphData object can be used to store time-based data without modification. The SRGDateScale object displays the scale and chooses a suitable format for the range of data. The range may be as little as a second or as big as several decades.
This derivative of SRGDecimalScale retrieves the annotations from the first group of data objects and arranges them as labels along the axis. SRGIndexScale is used by many chart types to label axes that have a discrete nature (e.g. years, product lines, company divisions, or countries).
This class is similar to SRGIndexScale, but SRGGroupScale displays the contents of the group headers – the annotations of the data list objects or rows.
A new set of classes allows users to configure or independently position scale bars or axes. SRGScaleBar, SRGIndexBar, SRGGroupBar, SRGDateBar, and SRGLogBar correspond to the axis scale classes listed above, but they are used like other components. They can be created and added to the component list of SRGraph.
These classes allow a chart to have multiple axes. These new classes are discussed in detail in Part II, "Programmer's Guide."
SRGCompoundDisplay is an alternative to SRGraphDisplay that was designed for easier customization. During standard display component processing, SRGraphDisplay automatically creates the axis scales, displays them, and destroys them as the axis limits change. Because the scales are maintained internally to SRGraphDisplay and because of their ephemeral quality, it is difficult to customize an axis scale — i.e., to change the label format, orientation, or spacing.
SRGCompoundDisplay contains four axis managers (one for each side of the display rectangle), which in turn control the axis scales, grid lines, tick marks, axis titles, data watchers, and display components. The appearance of any of these sub-components can be modified by setting the related style flags or by deriving a new class to incorporate totally new behavior. In particular, charts with two y-axes or two x-axes with related numerical scales are easy to implement.
The capabilities and utilization of compound displays are discussed in Part II, "Programmer's Guide."
Copyright © Rogue Wave Software, Inc. All Rights Reserved.
The Rogue Wave name and logo, and Stingray, are registered trademarks of Rogue Wave Software. All other trademarks are the property of their respective owners.
Provide feedback to Rogue Wave about its documentation.