


29.3 An Example: An ATL ActiveX Control Built From Objective Chart
As an illustration of the procedures involved, consider this walkthrough demonstration of building a control that wraps Objective Chart functionality.
After launching Visual Studio, start up a new project and select the ATL Project template. Name your new project acmechart:
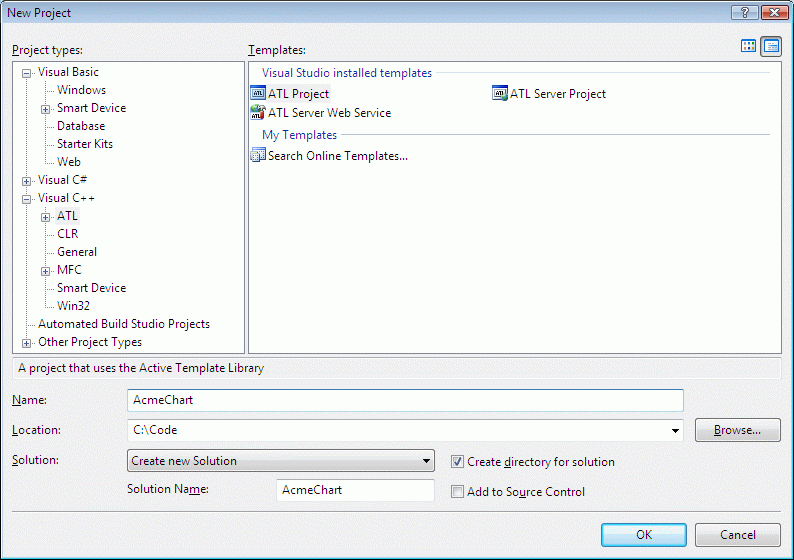
Click OK and proceed to the next screen.
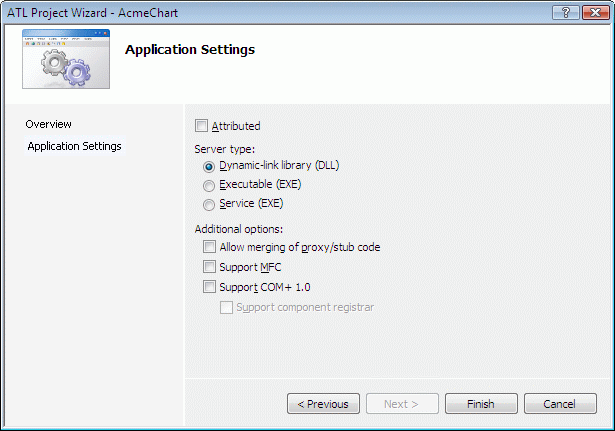
Clear the Attributed option and select Support MFC.
Remember to select Support MFC. This is required; if you don't, when you attempt to insert your Objective Chart component as an ATL object, the object wizard will display an error message and will not allow you to proceed.
Click Finish.
Once your initial project files are generated, from the Project|Add Class menu, choose ATL Control to insert the Objective Chart component. The custom object wizard for the Objective Chart control is shown highlighted in Figure 156.
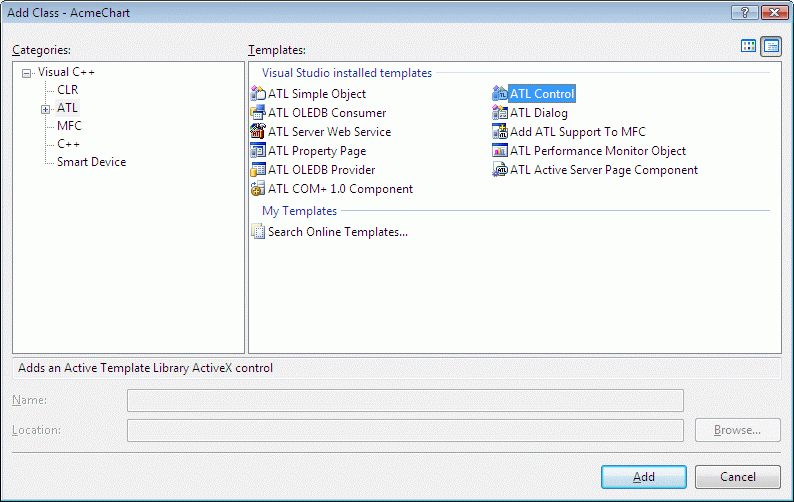
With the ATL Control template selected, click Open to produce the following dialog box:
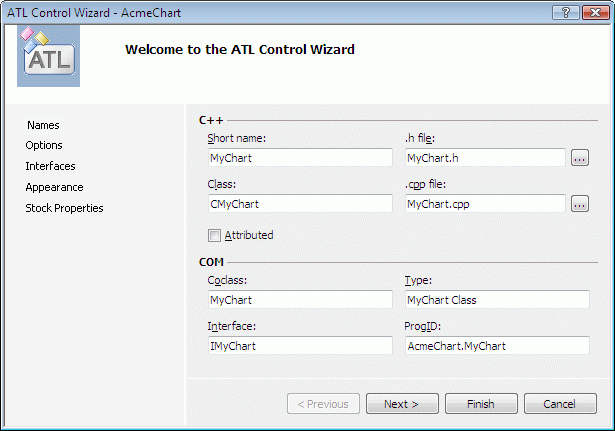
Type the short name myChart. The wizard automatically derives class names, file names, an interface name, and so forth.
Accept these defaults by clicking Finish.
The wizard should take only a couple of seconds to generate the required source code. Examine the Class View tab of the Project Explorer:
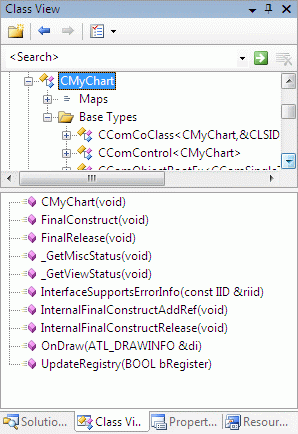
The wizard has generated all the required source code to instantiate and run an Objective Chart control. Note that the one exported method, SetValue(), is provided only as an example. As a developer, you will add method declarations (under the Imychart interface) and implementation (under Cmychart) to export and/or extend the Objective Chart's functionality in your own custom control.
29.3.1 Pre-Build Set-Up
We are almost ready to build our control, but first there are a few things we must do manually. We'll add Objective Chart's resources to the project through the Resource Includes dialog. Then we'll change some project settings.
Select the ResourceView tab of the Project Explorer.
Right-click acmechart resources, and select Resource Includes from the pop-up menu.
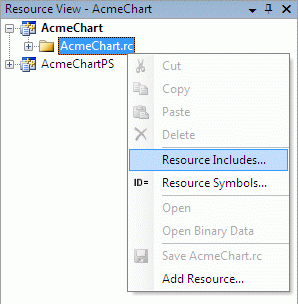
Add directives in the dialog box to make it look like the following:
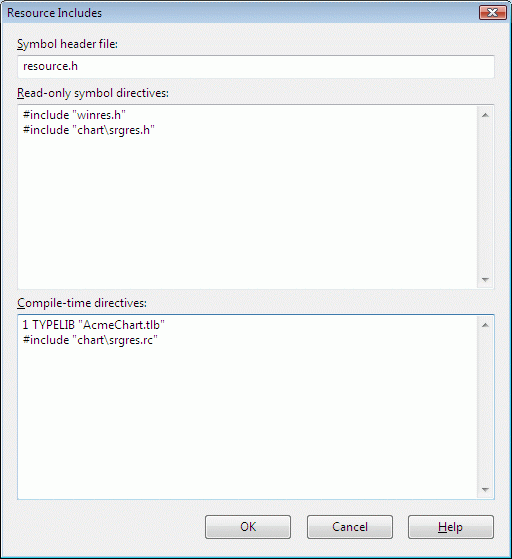
The lines we've added are:
#include "chart\srgres.h"
|
...under Read-only symbol directives:
and
#include "chart\srgres.rc"
|
...under Compile-time directives:
Click OK to dismiss the Resource Includes dialog box, and you'll see the following message box:

Click OK.
29.3.2 Building and Testing A Control
We can now build our control!
Start the build process.
Note the explanatory text output in the build results tab, which recaps the steps we completed immediately before starting the build.
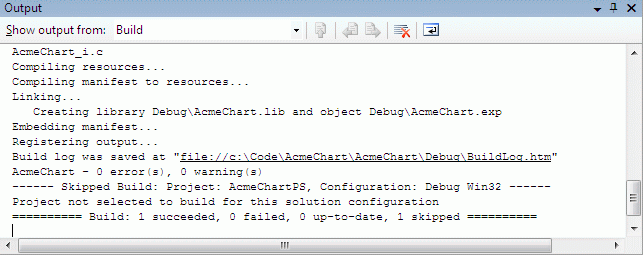
You're ready to test. If you set Visual Basic as the executable for debug session (in the Project/Settings dialog, debug tab), press F5 to launch Visual Basic.
You can proceed in one of two ways from this point.
Option 1: Use a ready-built VB project that has already been set up for us to contain and test the control we've just built. This project is created by the same wizard that we used to insert the Stingray component into our project as a new custom ATL object, and is placed in our Visual C++ project directory. A name is generated for the VB project by the wizard, and consists of the short name we gave it for the custom object's class, followed by "Proj1". For example, in our example here, we've used "mychart" for our short name, so the wizard would set up our test VB client project for us and name it "mychartProj1". When VB initially launches, choose the Existing tab of the opening dialog box and see that your project is there waiting for you.This project already references the control we've just built by GUID, and contains some code to test it in the Form/Load procedure.
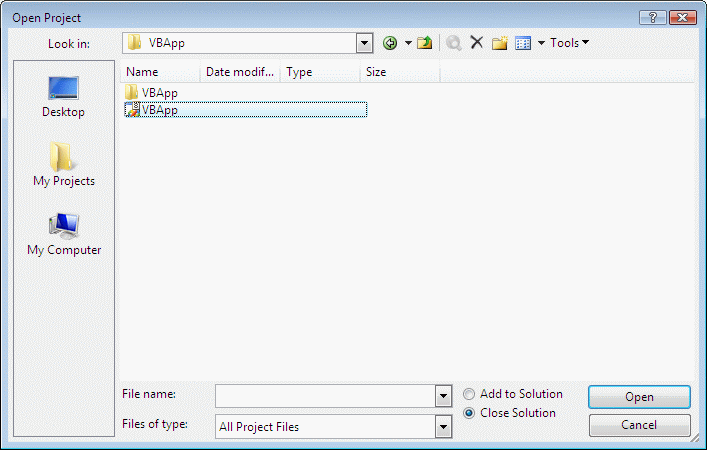
Option2: Alternatively, we can start a new VB project from scratch, add in the control we've just built, and proceed from there. This second option is the one we've chosen to illustrate in detail.
First, after pressing F5 (or from the Build menu, choose Start Debug/Go) to launch VB, create a new Visual Basic project by selecting "Standard EXE") on the New tab.
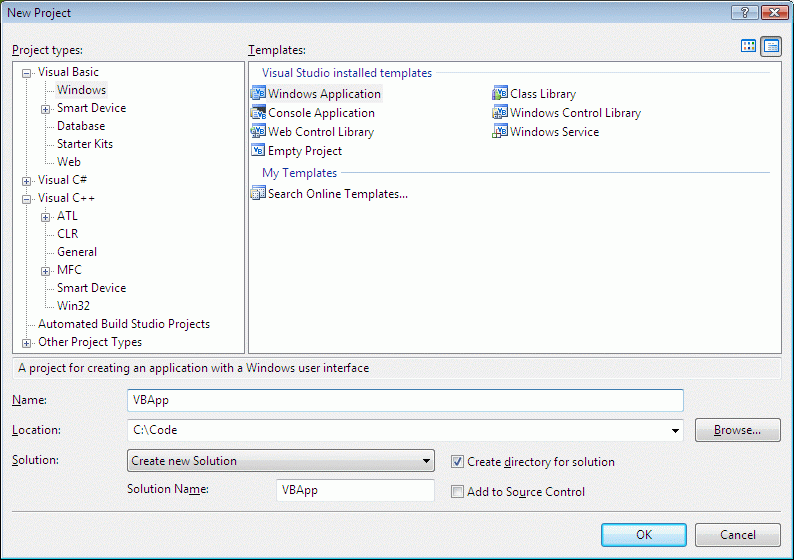
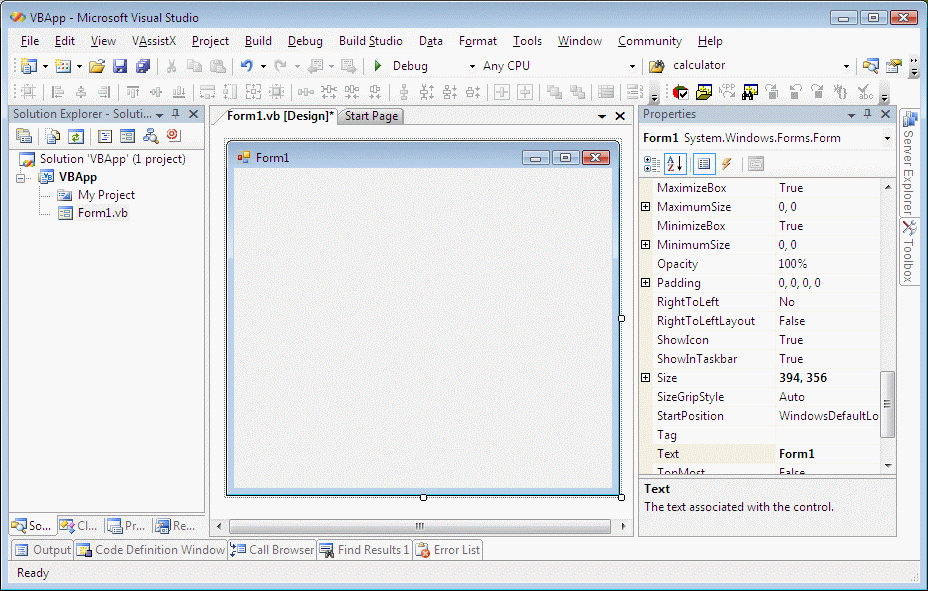
This leads to the familiar VB default new project development environment…
Now, add your freshly-built ActiveX control to your VB form. On VB's Project menu, select Components… and find your ActiveX library.
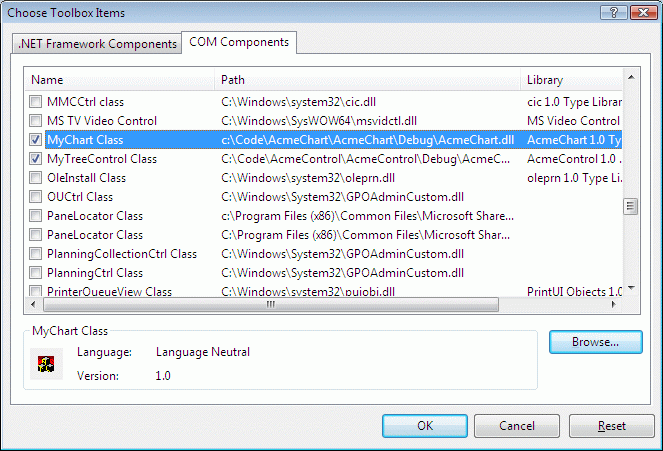
After you click OK, the icon for the control (currently the default ATL icon) is placed on VB's tool palette.
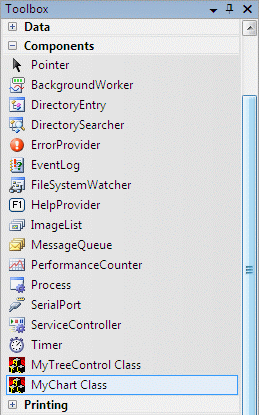
Click the chart control icon (circled above) and draw an instance of the Objective Chart control on the VB form.
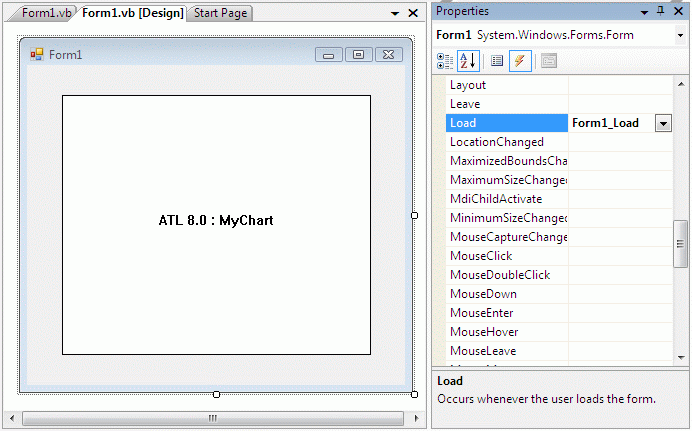
Add code to the Form_Load procedure:

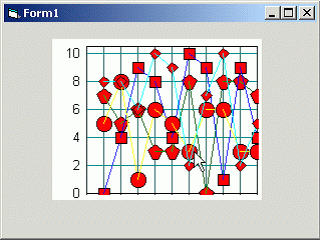
Finally, run the VB project.


Copyright © Rogue Wave Software, Inc. All Rights Reserved.
The Rogue Wave name and logo, and Stingray, are registered trademarks of Rogue Wave Software. All other trademarks are the property of their respective owners.
Provide feedback to Rogue Wave about its documentation.


