
In addition to the compound component classes (SRGCompoundComponent, SRGCompoundDisplay, and SRGAxisManager), this section introduces three other new component classes — SRGTickMarks, SRGGridLines, and SRGDataWatcher. These classes may be used standalone (SRGDataWatcher) or within the internals of SRGraphDisplay (SRGTickMarks). Because they are integral parts of SRGAxisManager, they are presented here.
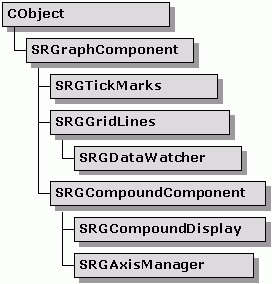
The hierarchy of these compound component and related classes is shown in Figure 138.

The SRGTickMarks class controls chart tick marks for many axis types. Two types of tick marks, major and minor, are provided. Major ticks are placed at positions corresponding to the labels on an axis. Minor ticks may be linearly interspersed between major ticks in a set ratio.
Major and minor ticks have individual settings for width, color, and length. The length of the minor tick is specified as a multiple (usually less than 1) of the length of the major tick. Furthermore, the side of the axis line upon which tick marks are drawn may be selected. This allows tick marks to be placed inside the rectangle of the axis.
The SRGTickMarks class is used internally by the standard SRGraphDisplay. The major tick marks are drawn at the list of tick-mark positions passed via the SetptrTickPositionList() function. This list of positions is usually generated by the CreateLabels() function of one of the axis scale classes. Tick marks are drawn perpendicular to the line connecting the first and last points in the list.
To set up a typical SRGTickMarks object:
SRGTickMarks *pT=new SRGTickMarks; // add tic marks pT->SetMajorTickColor(CXCLR_BLUE); // blue pT->SetMajorTickWidth(3); // fat (default=1) pT->SetMajorTickSize(8); // length in pixels (def.=5) pT->SetMinorTickRatio(4); // fifths pT->SetMinorTickColor(CXCLR_SKY); // blue-green pT->SetMajorTickWidth(1); // thin pT->SetMinorTickSize(.6); // fraction of major (def=.75) pT->SetTickSide(TRUE); // to right of axis line |
Similar in usage to the SRGTickMarks class, this class provides a flexible method of adding grid lines to a chart. Major and minor grid lines with individually controlled styles are available to complement the tick-mark system. Color, line thickness, and line style (dots and dashes, etc.) are individually selectable for both major and minor grid lines.
Within Objective Chart, the SRGGridLines class is used exclusively as a sub-component of compound displays. The major grid lines are drawn at the list of tick-mark positions passed via the SetptrTickPositionList() function.
Member functions provide full flexibility for selecting the appearance of the major and minor grid lines. Their parameters are simply passed on to the CPen::CreatePen() or CreatePenIndirect() functions.
To select a color, style, and line width, use standard CreatePen() parameters.
SRGGridLines *pG=new SRGGridLines; pG->SetMajorGridColor(CXCLR_BLUE); // blue pG->SetMajorGridStyle(PS_SOLID); // solid pG->SetMajorGridWidth(3); // fat |
Or, set the style to PS_USER_STYLE and create a list of DWORD styles:
SRGGridLines *pG=new SRGGridLines;
pG->SetMinorGridColor(CXCLR_BLUE);    // blue
// custom dash pattern
pG->SetMinorGridStyle(PS_USER_STYLE);
DWORD dDitDot[4]={8,4,4,4};
pG->SetMinorStyleList(dDitDot);
pG->SetMinorStyleCount(4);
pG->SetMinorGridWidth(1);             // thin
|
Or, create a LOGPEN structure for CreatePenIndirect():
SRGGridLines *pG=new SRGGridLines; LOGPEN lp; lp.lopnStyle = PS_DASH; lp.lopnWidth = 1; lp.lopnColor = CXCLR_RED; pG->SetMinorGridLogPen(&lp); |
To set the number of minor grid lines between each major grid line, call SetMinorGridRatio(n); n=0 for no minor grid lines.
SRGGridLines *pG=new SRGGridLines; pG->SetMinorGridRatio(1); // half way |
If you create a custom chart type or custom axis type, override DrawHGridLine() and/or DrawVGridLine() to add your new type. If your custom axis requires nonstandard grid lines, override DrawCustomHGrid() and/or DrawCustomVGrid().
This specialized class monitors the data values in a chart and triggers events when the data exceed preset limits.
Data watchers can be used with standard displays as well as compound displays. The operation and use of data watchers are described in detail in Chapter 21, "Data Surveillance."
When used in conjunction with a compound display, the SRGDataWatcher is registered with and managed by an SRGAxisManager object. Then the data watcher uses information from the display component of the same axis manager.
A data watcher can draw a line (or lines) on the display indicating the limit level(s). Because SRGDataWatcher is derived from SRGGridLines, the appearance of its line(s) can be modified in the same way.
To set up a typical data watcher with a compound display:
SRGDataWatcher *pDW=new SRGDataWatcher; // set condition and limit values pDW->SetScanType(CX_SCAN_OUTOFBRACKET); pDW->SetHighLimit(25.4*120); // Ten feet in mm pDW->SetLowLimit(25.4*36); // Three feet in mm pDW->SetVisible(TRUE); // draw lines // set number of groups per series, if more than 1 pDW->SetGroupStep(2); // set appearance using SRGGridLines methods pDW->SetMajorGridColor(CXCLR_RED); pDW->SetMajorGridWidth(3); pCD->SetYDataWatcherA(pDW); |
For the conditions that require only one limit, use SetHighLimit().
This component class is able to hold and maintain its own component list. Components on this list are drawn in order in much the same way that the components on the main SRGraph component list are. A compound component may itself be used as a sub-component thereby allowing complex, nested display objects to be created.
This display class is especially designed to allow fast development of custom charts. The class constructor creates four sub-components of the type SRGAxisManager and adds them to its component list. The SRGAxisManager objects, in turn, hold labels, tick marks, grid lines, data watchers, and displays. The compound display can be used to create ad hoc custom charts. To create a chart you only need to instantiate the relevant classes and add them to the compound display's axis managers. The axis managers then draw the sub-components in the correct places and with appropriate scales.
Charts with two y-axes or two x-axes can specify the relationship between the axis scales. Functions are provided to lock the numerical ratios of the axes together. A virtual function – CalcXRelationship() or CalcYRelationship() – can be overridden to establish more complex relationships.
A compound display can draw up to four axes along the edges of a rectangular frame. It is not compatible with graph types that use pseudo-3D or circular axes.
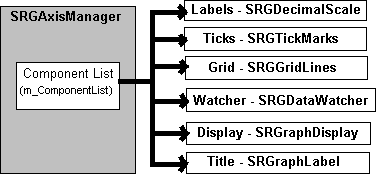
This sub-component of the compound display manages one side of the chart rectangle used by the SRGCompoundDisplay object. Its constructor initially creates a list of six sub-components that draw nothing. These may be replaced as needed by label blocks, tick marks, grid lines, data watchers, displays, and axis titles to create a portion of a custom chart. Figure 139 shows the sub-components of SRGAxisManager.

The axis manager coordinates the positions of labels, tick marks, and grid lines through a common list of CPoint objects.
The axis manager accesses these various sub-components by their position in the list. Therefore, the supplied RegisterXXX() and UnregisterXXX() functions should always be used to add or remove sub-components. Do not access the sub-component list directly.
Copyright © Rogue Wave Software, Inc. All Rights Reserved.
The Rogue Wave name and logo, and Stingray, are registered trademarks of Rogue Wave Software. All other trademarks are the property of their respective owners.
Provide feedback to Rogue Wave about its documentation.