Customizing a Plot
The core of PV-WAVE is visualization. Because of this, the look and feel of plots is highly customizable.
This section demonstrates some of the following concepts when modifying the plot’s look and feel:
Using Different Marker Symbols
Using Patterns to Highlight Plots
Specifying Location of the Plot
Drawing Multiple Plots on a Page
Using Keyword Parameters
The plotting procedures are designed to produce acceptable results for most applications with a minimum amount of effort. The plotting and graphics keyword parameters and system variables, which are described in the (Undefined variable: pvwave.waveur), allow you to customize your graphics output. Examples in this chapter show how to use many of the major keywords and system variables used to modify 2D graphics.
Adding Titles
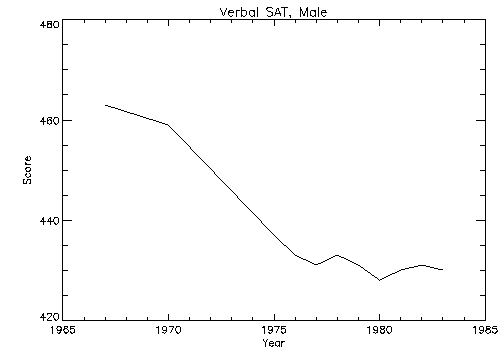
The Title, XTitle, and YTitle keywords are used to produce axis titles and a main title in the plot shown in Plot with Title Annotation. This figure was produced with the statement:
PLOT, YEAR, VERBM, /YNozero, Title='Verbal SAT, Male', $
XTitle='Year', YTitle='Score'
|
Note |
This example uses data created in Linear Plots. |
|
|
Annotating Plots
An obvious problem with overplotting is that it lacks labels describing the different lines shown. To annotate a plot, select an appropriate font and then use the XYOUTS procedure.


