Interpretation of the Color Index
The interpretation of the color index varies among the devices supported by PV‑WAVE. With color video displays, this index selects a color (normally an RGB triple) stored in a device table. You can control the color selected by each color index with the TVLCT procedure which loads the device colortables. TVLCT is described in the (Undefined variable: pvwave.waveur).
Other devices have a fixed color associated with each color index. With plotters, for example, the correspondence between colors and color index is established by the order of the pens in the carousel.
Specifying Location of the Plot
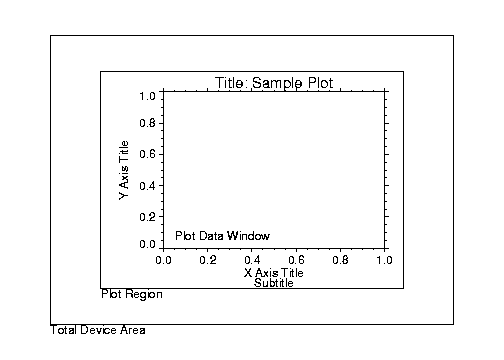
The plot data window is the region of the page or screen enclosed by the axes. The plot region is the box enclosing the plot data window and the titles and tick annotation. Plot Locations illustrates the relationship of the plot data window, plot region, and the entire device area (or window if using a windowing device).
|
|
These areas are determined by the following system variables and keyword parameters, in order of decreasing precedence. Each of these keywords and system variables are described in the (Undefined variable: pvwave.waveur).
Position keyword
!P.Position system variable
!P.Region system variable
!P.Multi system variable
XMargin, YMargin, and ZMargin keywords
!X.Margin, !Y.Margin, and !Z.Margin system variables
Drawing Multiple Plots on a Page
Plots may be grouped on the display or page in the horizontal and/or vertical directions using the !P.Multi system variable field. PV‑WAVE sets the plot window to produce the given number of plots on each page and moves the window to a new sector at the beginning of each plot. If the page is full, it is first erased. If more than two rows or columns of plots are produced, PV‑WAVE decreases the character size by a factor of 2.
!P.Multi controls the output of multiple plots and is an integer vector in which:
!P.Multi(0)—The number of empty sectors remaining on the page. The display is erased if this field is 0 when a new plot is begun.
!P.Multi(1)—The number of plots across the page.
!P.Multi(2)—The number of plots per page in the vertical direction.
For example, to stack two plots vertically on each page specify the following value for !P.Multi.
!P.Multi = [0,1,2]
Note that the first element, !P.Multi(0), is set to zero to cause the next plot to begin a new page. To make four plots per page, with two columns and two rows:
!P.Multi = [0,2,2]
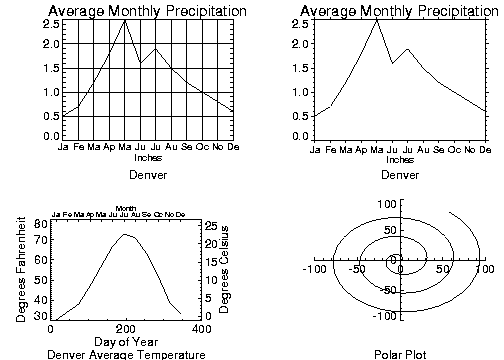
Multiple Plots illustrates the two rows and two columns format. Use the following command to reset the display to the default setting of one plot per page.
!P.Multi = 0
|
|