OPLOT Procedure
Plots vector data over a previously drawn plot.
Usage
OPLOT, x[, y]
Input Parameters
x—A vector. If only one parameter is supplied, x is plotted on the y-axis as a function of point number.
y—(optional) A vector. If two parameters are supplied, y is plotted as a function of x.
Keywords
OPLOT keywords let you control many aspects of the plot’s appearance. These keywords are listed below. For a description of each keyword, see Graphics and Plotting Keywords.
Discussion
OPLOT differs from PLOT only in that it does not generate a new axis. Instead, it uses the scaling established by the most recent call to PLOT and simply overlays a plot of the data on the existing axis. Each call to PLOT establishes the plot window (the region of the display enclosed by the axes), the axis types (linear or log), and the scaling. This information is saved in the system variables !P, !X, and !Y, and used by subsequent calls to OPLOT.
Example
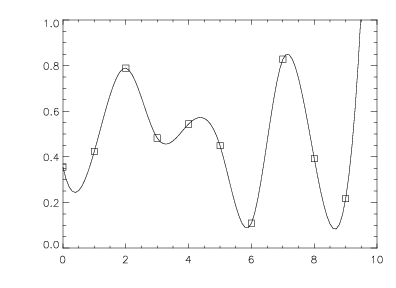
In this example, 10 random points are plotted as square markers using the PLOT procedure. Procedure OPLOT is then used to plot a cubic spline interpolant to the random points. The square markers at the random points remain in the plotting window when the interpolant is plotted because OPLOT draws over what is already in the plotting window. This example uses the PV‑WAVE IMSL Mathematics Toolkit and PV‑WAVE IMSL Statistics Toolkit functions CSINTERP, RANDOMOPT, RANDOM, and SPVALUE. The results are shown in Overplotting a Plot.
; Initialize the IMSL Mathematics Toolkit
math_init
; Create a vector of 10 random values.
RANDOMOPT, Set=45321
x = RANDOM(10)
; Plot the random points as a function of vector index. Use
; square marker symbols to represent the data points.
PLOT, x, Psym=6
pp = CSINTERP(FINDGEN(10), x)
; Compute the cubic spline interpolant.
ppval = SPVALUE(FINDGEN(100)/10, pp)
; Plot the interpolant over the marker symbols.
OPLOT, FINDGEN(100)/10, ppval
|
|
See Also
For more information, see the PV‑WAVE User Guide.


