OPLOTERR Procedure
Standard Library procedure that overplots symmetrical error bars on any plot already output to the display device.
Usage
OPLOTERR, x, y, error[, psym]
Input Parameters
x—A real vector containing the x-coordinates of the data to plot. If not present, x is assumed to be a vector of the same size as y and to have integer values beginning at 0 and continuing to the size of y – 1.
y—A real vector containing the y coordinates of the data to plot.
error—A vector containing the symmetrical error bar values at every element in y.
psym—(optional) Specifies the plotting symbol to use. It corresponds to the system variable !Psym. If not specified, the default is 7 (the symbol “X”).
Keywords
None.
Example 1
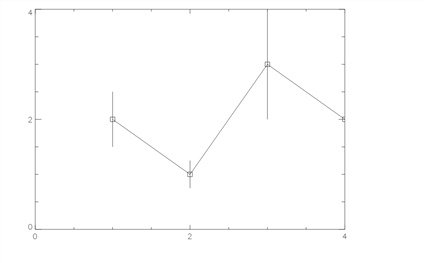
To plot error bars over the x and y vectors, with symbols at the data values, use the following commands:
x = [1, 2, 3, 4]
y = [2, 1, 3, 2]
PLOT, x, y
error = [0.5, 0.25, 1, 0]
psym = 6
OPLOTERR, x, y, error, psym
This produces the plot shown in Plotting Error Bars In this example, OPLOTERR was used to plot error bars over the x and y vectors, using the square symbol at the data values.
|
|
Example 2
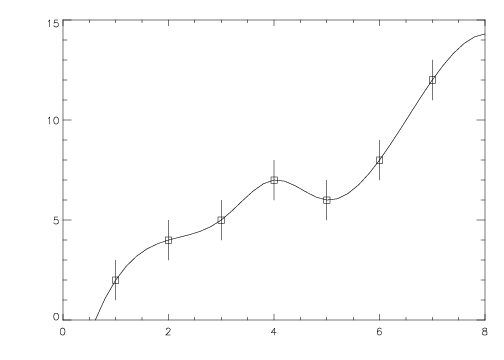
This example plots a B-spline interpolant to some scattered data. The data points, along with error bars extending one unit on either side of the data points, are then plotted on top of the interpolant. This example uses the PV‑WAVE IMSL Mathematics Toolkit function BSINTERP. The results are shown in Scattered Data Interpolant with Overplotted Data Points.
; Generate the abscissas and create a vector of ordinates.
x = INDGEN(7) + 1
y = [2, 4, 5, 7, 6, 8, 12]
; Initalize the IMSL Mathematics Toolkit
math_init
; Compute the B-spline interpolant and plot the interpolant.
bs = BSINTERP(x, y)
bsval = SPVALUE(FINDGEN(100)/5, bs)
PLOT, FINDGEN(100)/5, bsval, XRange=[0, 8], YRange=[0, 13]
; Create the error bar vector.
err = MAKE_ARRAY(7, Value=1)
; Overplot the data points, using square marker symbols and
; the error bars.
OPLOTERR, x, y, err, 6
|
|
See Also
System Variables: !P.Psym


