PLOTS Procedure
Plots vectors or points on the current graphics device in either two or three dimensions.
Usage
PLOTS, x[, y[, z]]
Input Parameters
x — A vector parameter providing the x-coordinates of the points to be connected.
If only one parameter is specified, x must be an array of either two or three vectors: (2,*) or (3,*). In this special case, x(0,*) is taken as the x values, x(1,*) is taken as the y values, and x(2,*) is taken as the z values.
y — (optional) A vector parameter providing the y-coordinates of the points to be connected.
z — (optional) If present, a vector parameter providing the z-coordinates of the points to be connected. If z is not specified, x and y are used to draw lines in two dimensions. z has no effect if the keyword T3d is not specified and the system variable !P.T3d = 0.
Keywords
Keywords let you control many aspects of the plot’s appearance. PLOTS keywords are listed below. For a description of each keyword, see Chapter 21: Graphics and Plotting Keywords.
Discussion
A valid data coordinate system must be established before PLOTS is called. (A call to PLOT can be used to establish this coordinate system.) Also note that a PV-WAVE window must be open and selected when the call to PLOTS is made for the procedure to work correctly.
The coordinates for PLOTS can be given in data, device, or normalized form using the Data, Device, or Normal keywords.
Example 1
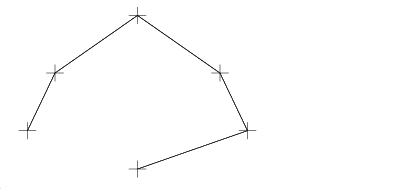
This example draws a series of connected lines using PLOTS. The results are shown in Figure 13-9: Connected Lines drawn with PLOTS.
WINDOW, Xsize=400, Ysize=400
xdata = [.1, .2, .5, .8, .9, .5]
ydata = [.3, .6, .9, .6, .3, .1]
TEK_COLOR
; Blue line.
PLOTS, xdata, ydata, Color=WoColorConvert(4)
WAIT, 1
; Magenta line.
PLOTS, xdata+0.05, ydata-0.02, /Normal, Color=WoColorConvert(6)
WAIT, 1
; Yellow line.
PLOTS, xdata, ydata, Symsize=5.0, Psym=-1, /Normal, $
Color=WoColorConvert(16)
 |
Example 2
This example plots a curve in R2, which is shown in Figure 13-10: Plot of R2. Notice that PLOT is first called to set up the two-dimensional coordinate system. Normally, PLOT would be called to perform the entire plot, but for demonstration purposes, PLOTS is used to complete the plot once the coordinate system has been defined.
; Set up the axes using PLOT.
PLOT, FINDGEN(2), /Nodata, XRange=[-1, 1], YRange=[-1, 1]
; Generate data.
p = FINDGEN(1000)/999
x = p * SIN(50 * p)
y = p * COS(50 * p)
PLOTS, x, y
 |
Example 3
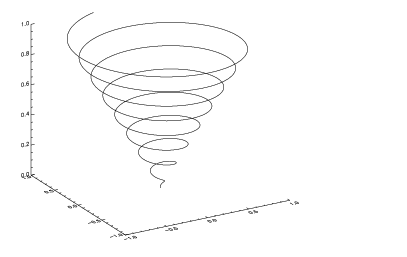
This example plot a curve in R3, which is shown in Figure 13-11: Plot of R3. Notice that SURFACE is called initially to set up the three-dimensional coordinate system. It is also important to note that keywords Nodata and Save are used when calling SURFACE, and keyword T3d is used in the call to PLOTS.
SURFACE, FINDGEN(2, 2), /Nodata, /Save, $
XRange = [-1, 1], YRange=[-1, 1], ZRange=[0, 1]
z = FINDGEN(1000)/999
x = z * SIN(50 * z)
y = z * COS(50 * z)
PLOTS, x, y, z, /T3d
 |
See Also
For additional examples, see the PV‑WAVE User’s Guide.


