ISOSURF Procedure
Computes, and optionally displays, an isosurface of the specified 3D data.
Usage
ISOSURF, data, valu, vert, poly
Input Parameters
data—3D array defining the field containing the isosurface.
valu—Scalar defining the isosurface data(x,y,z)=valu.
Output Parameters
vert—A (3, n) array of vertices on polygons defining the isosurface.
poly—Array of indices into vert(0,*) which define the polygons.
Keywords
Xdat—The x values for data. Defaults to LINDGEN((SIZE(data))(1)).
Ydat—The y values for data. Defaults to LINDGEN((SIZE(data))(2)).
Zdat—The z values for data. Defaults to LINDGEN((SIZE(data))(3)).
Show—If set vtkPOLYSHADE displays the isosurface and all of the remaining keywords control the particulars of the graphic.
Cdat—Byte array of the same dimensions as data. Cdat defines a color table index for each element of data, and the isosurface is colored according to the values of Cdat on the isosurface. Cdat is useful in one of two ways: If Cdat is a byte-scaled version of data then the isosurface is light-source shaded in the single color representing valu, but if Cdat represents a second field variable then the isosurface is light-source shaded in colors representing values of the second field on the isosurface. On output, Cdat is replaced with the interpolated value at each vertex.
Cbar—Two element array defining the minimum and maximum values of the field represented by the color table, i.e., Cbar(0) is the field value associated with color index 0, and Cbar(1) is the field value associated with color index 255. If set, this keyword adds a color bar to the plot.
Acol—Name of a color to use for all axes and annotation. See the file <RW_DIR>/vtk-3_2/lib/vtkcolornames.pro for a complete list of supported color names, where <RW_DIR> is the path to the PV-WAVE installation. The default is 'white'.
Title—Title for the plot.
Ctitle—Title for the color bar (see Cbar).
Save—Name of image file in which the initial graphic is stored. Normally, this keyword is a scalar string, but optionally it can be set to a 4-element list where Save(0) is the name of the image file, Save(1) is a title overlaid on the image, and (Save(2),Save(3)) are normalized coordinates for the origin of the title block. This optional syntax offers flexibility that the VTK-text-based Title keyword does not: positional control and the full complement of fonts available in PV-WAVE.
note | When using the Save keyword, any window obscuring the VTK window will also be saved. |
All other keywords are passed directly to vtkPOLYSHADE, which uses presentation style annotation (see its Presentation keyword). The keywords passed directly to vtkPOLYSHADE are:
Discussion
None.
Example
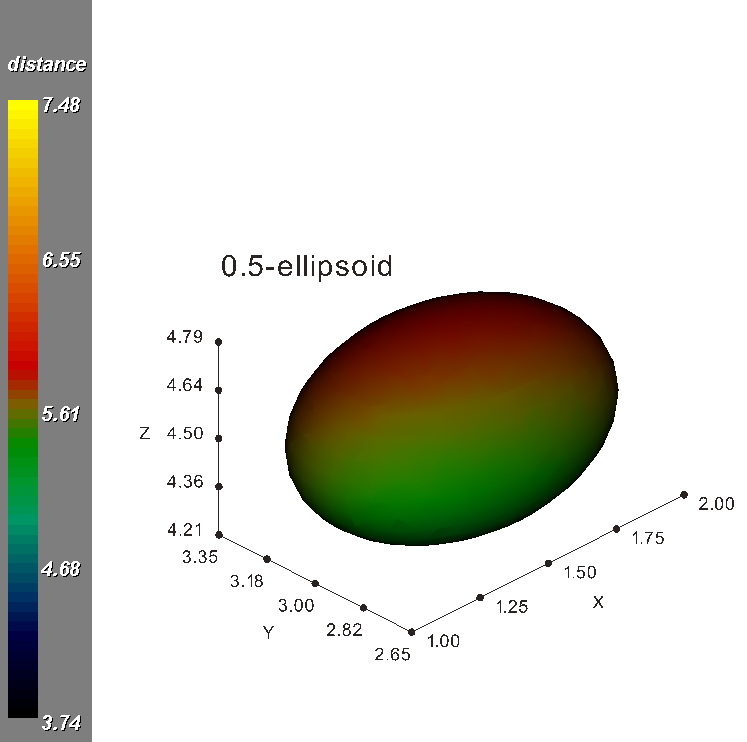
This example shows how to generate vertices and polygons defining an isosurface of a field defined by a 3D array. The vertices and polygons are returned from ISOSURF, and the isosurface is displayed in a VTK window and colored according to values of a second field on the isosurface, in this case, an ellipsoidal isosurface colored according to its distance from the origin.
; First, define a coordinate grid for the fields:
x = LINSPACE(21, 1, 0.05D)
y = LINSPACE(41, 2, 0.05D)
z = LINSPACE(61, 3, 0.05D)
; 3D array representing distance from the origin:
d = SQRT(TENSOR_ADD(x*x, TENSOR_ADD(y*y, z*z)))
; 3D array representing a family of confocal ellipsoids:
a = x - (MIN(x, MAX=m)+m)/2
b = y - (MIN(y, MAX=m)+m)/2
c = z - (MIN(z, MAX=m)+m)/2
e = SQRT(TENSOR_ADD(a*a, TENSOR_ADD(2*b*b, 3*c*c)))
; Generate the isosurface and show the results:
LOADCT, 4
vtkWINDOW, Xsize=800, Ysize=800, Background='white'
ISOSURF, e, 0.5, v, p, Xdat=x, Ydat=y, Zdat=z, /Show, $
Cdat=bytscl(d), Cbar=[MIN(d,MAX=m),m], Acol='black', $
Title='0.5-ellipsoid', Ctitle='distance', $
Xtitle='X', Ytitle='Y', Ztitle='Z', $
Xticks=4, Yticks=4, Zticks=4
INFO, v, p
;PV-WAVE prints:
; V FLOAT = Array(3, 1010)
; P LONG = Array(5136)
 |
See Also


