Introduction to Date/Time Data
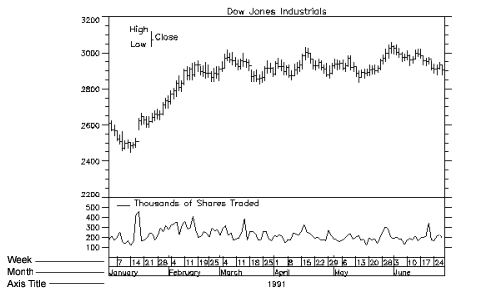
PV‑WAVE’s date/time feature provides a precise method for creating two-dimensional plots with date/time data represented on the X axis. Once you have generated date/time data, you can create plots that reflect various levels of time intervals. The PLOT procedure automatically draws and labels the date/time axis. Figure 8-1: Date/Time Plot illustrates a plot with two levels of date/time labeling:
 |
The date/time axis is well-suited for the display of data that follows an hourly, daily, weekly, or monthly pattern; financial and meteorological data are two examples of this type of data. By default, PV‑WAVE labels a date/time axis with up to six levels of tick labels that show the time frame of the data that is being displayed.
The four basic steps for creating a date/time plot are:
Reading Your Data
Read your data from an input file into PV‑WAVE using a command such as DC_READ_FREE, DC_READ_FIXED, READF or READU.
The DC_READ_FIXED and DC_READ_FREE functions can be used with the DT_Template keyword to read data directly into date/time variables. See the descriptions for the DC_READ_FIXED and DC_READ_FREE functions in the PV‑WAVE Reference for detailed information on these routines and examples of their use.
The READU and READF procedures can be used to read dates/times into atomic data types, which must then be converted into date/time variables. For a complete account of these input procedures, see Chapter 9: Working with Data Files in the PV‑WAVE Programmer’s Guide.
Converting the Data to the Date/Time Format
If you read your data into PV‑WAVE with the READU or READF procedures, you must use conversion functions to convert the date/time information into date/time variables.
There are four functions that you can use to convert your date/time data: STR_TO_DT, VAR_TO_DT, SEC_TO_DT, and JUL_TO_DT. The function you use depends on the configuration of the data you are reading in. See "Converting Your Data into Date/Time Data" for details.
note | In some instances, your input file may not contain explicit date/time information. You can generate a scalar date/time variable with one of the conversion functions and then use the DTGEN function to create a date/time variable containing an array of date/time structures. See "Generating Date/Time Data" for details. Also see Examples 1, 2, and 3 in "Creating Plots with Date/Time Data". |
Manipulating the Date/Time Data
After you have created date/time data, you may want to alter it. PV‑WAVE provides two functions, DT_ADD and DT_SUBTRACT, to add to or subtract date/time intervals from a date/time variable. You may also want to eliminate holidays and weekends from your data with the CREATE_HOLIDAYS and CREATE_WEEKENDS procedures. For details, see "Manipulating Date/Time Data".
Plotting Your Data
You can plot your date/time data with PLOT or OPLOT. PV‑WAVE automatically generates labels and tick marks for your date/time data. If you want to modify the appearance of the date/time axis, PV‑WAVE provides several keywords. For details, see "Creating Plots with Date/Time Data".


