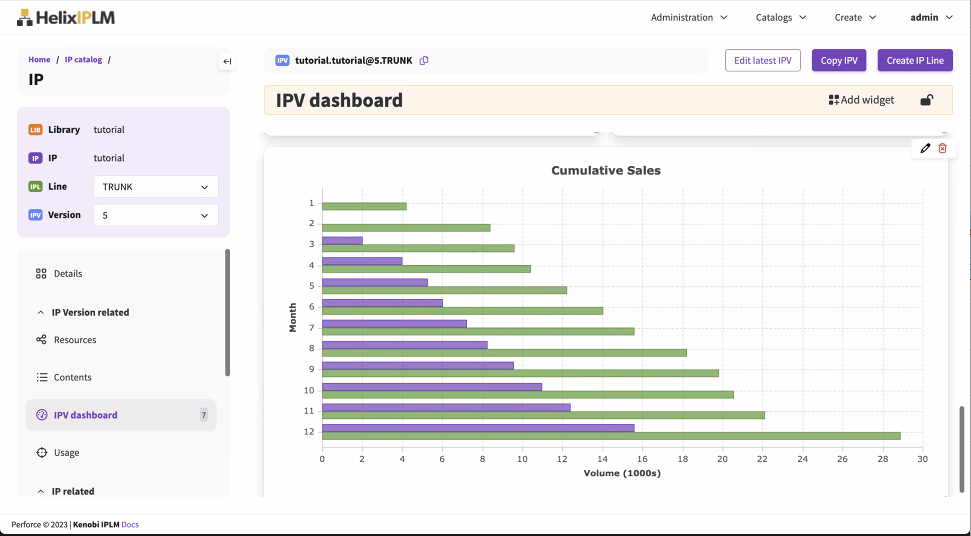
Chart widget
Chart widgets can display area charts, bar charts, line charts, pie charts, and scatter charts for a Library, IP, IPV, or Saved query.
Creating a chart widget in the Widget Editor
The Widget Editor is available on IP and IPV dashboards. It is not available on the Saved query and Library dashboards.
-
Select an IP or IPV, then select Dashboard in the navigation. If this is the first widget, you will see a message about your first widget. If this is not the first widget, select the lock icon to unlock the dashboard. See Widget Editor for more details.
-
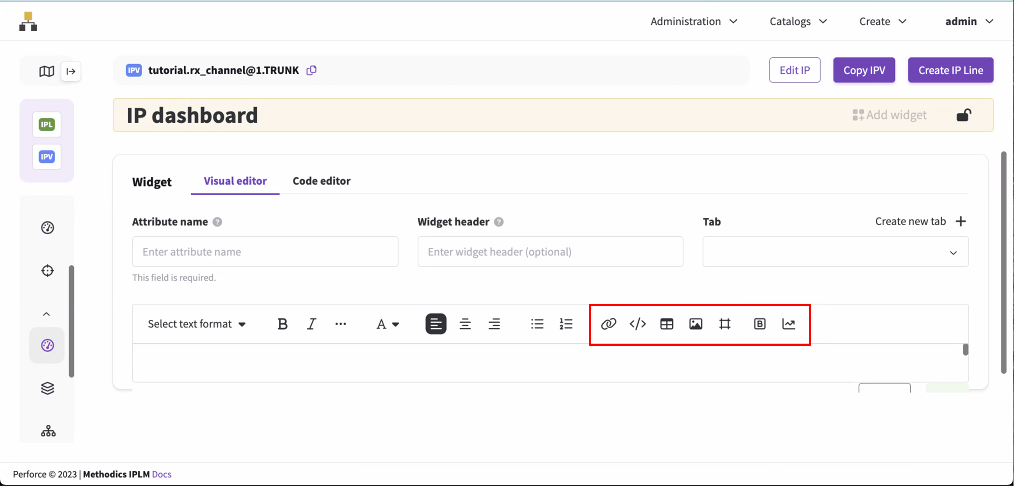
Select Add widget. The visual editor opens.
-
Enter the attribute name. The attribute name stores the widget data in the IPLM database and is not shown on the dashboard. The attribute name is required and cannot be changed after it is created.
.jpg)
-
Optionally, you can enter a widget header. The widget header is shown on the dashboard above the widget in addition to the widget title. You can use markdown formatting to style the widget header. See Using Markdown in text and table widgets.
.jpg)
-
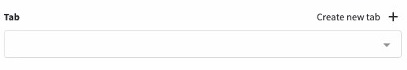
Optionally, you can select an existing tab or create a new tab where the widget will be shown. These custom tabs are displayed across the top of the dashboard.
-
Select the chart icon
 above the main text box. The Chart Widget Editor opens.
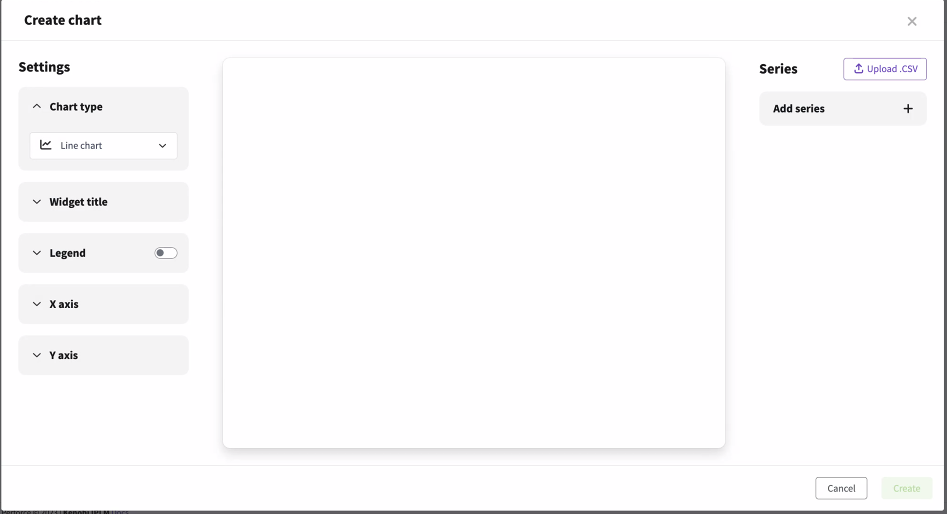
-
Select Upload .CSV to upload data for the chart or select Add series to manually enter the data.
-
In the .CSV file, enter the data in the following order:
Line 1: Series1 X,Series1 Y,Series2 X,Series2 Y
Line 2 and subsequent: <Series one axis>,Data,<Series 2 axis>,Data
See chart_data_example.csv for an example of how to organize the data.
-
In the Add series dialog, first enter the series name, and select the check mark. Then select the grid icon
 to enter the data.
-
-
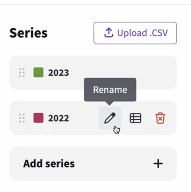
Once the data is entered, you can rename the series, edit the data, or delete the series.
-
Use the settings menu to select the chart type to view the data displayed in different ways.
If the chart type requires numbers or categories for the axis, the data type will automatically switch when you select the new chart type.
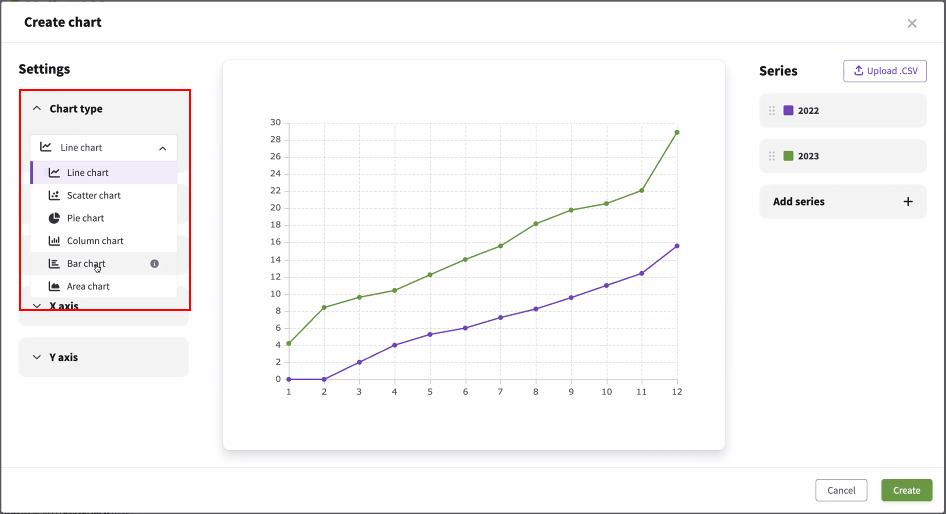
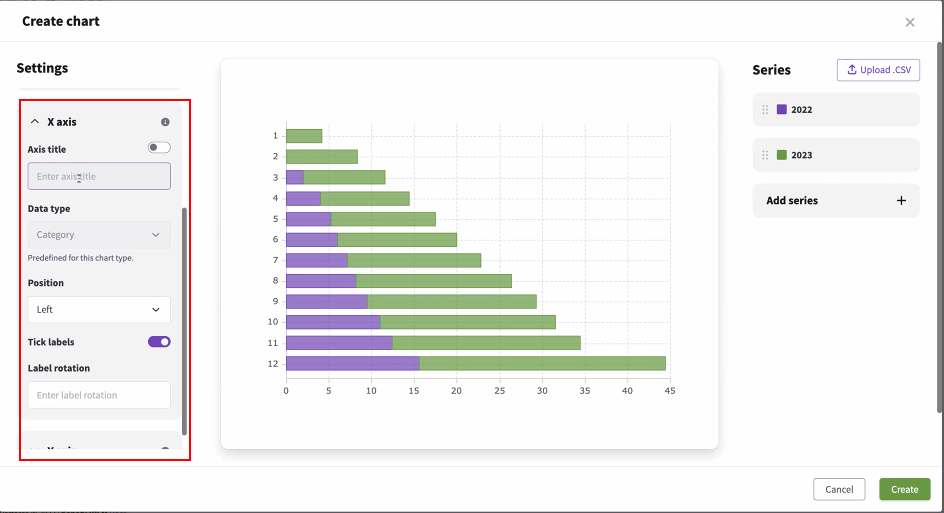
Each chart type has different settings that you can customize. When you make changes, they are shown immediately on the chart.
-
Once you are done formatting the chart, select Create, and then click Save.