Using dashboards
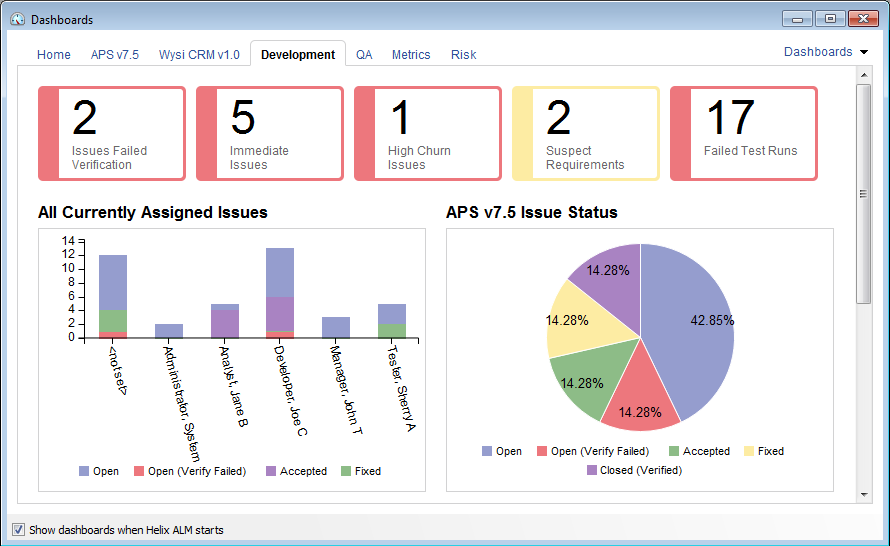
When you log in to Helix ALM, dashboards are the first thing you see. Dashboards show important project information and can help you quickly see project status and progress, items assigned to you, recent project activity, and more. Each dashboard includes widgets that display specific project data.
Note: An administrative user or another user with high-level security permissions, such as a team lead, is usually responsible for configuring dashboards.
Opening dashboards
To open dashboards,
Tip: If you do not want dashboards to open when Helix ALM starts, clear Show dashboards when Helix ALM starts.
Switching dashboards
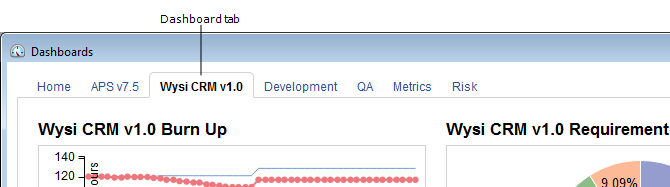
Depending on the configuration, you may have access to multiple dashboards used for different purposes. To switch dashboards, click the tab for the dashboard you want to view. You can drag dashboards left or right to reorder them.
Showing and hiding dashboards
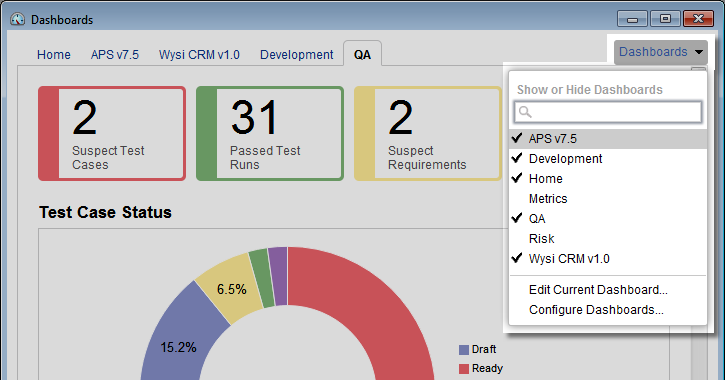
If you can view multiple dashboards, you can access them from the Dashboards menu.
- To show a dashboard, click Dashboards and choose the dashboard to show. Check marks indicate currently displayed dashboards. You can also search for dashboards by name.
- To hide a dashboard, click Dashboards and choose the dashboard to hide. You can also mouse over a dashboard and click
 to hide it.
Project information is displayed in widgets on a dashboard. The following widget types may be used on a dashboard. See Dashboard widget types for more information and examples.
| Widget type | Displays: | To use the widget: |
|---|---|---|
| Burn down | A chart of the work left to do in an iteration, sprint, release, or project phase. | Mouse over data in the chart to view more information. Mouse over a data type in the legend to highlight the corresponding data on the chart. Click a data type in the legend to hide the corresponding data from the chart. Click a hidden data type to show the data on the chart. Mouse over a widget and click  to expand it. Click to expand it. Click  to collapse the widget and return to the dashboard. to collapse the widget and return to the dashboard. |
| Burn up | A chart of the work done in an iteration, sprint, release, or project phase. | |
| Chart | Various project metrics and statistics in a chart format. | |
| Count | The total number of items that pass a specific filter. | Click it to view items that pass the filter. The items open in a new tab with the filter applied. |
| Currently Assigned to Me | The items currently assigned to you. | Click an item tag or summary to open the item. Click a column heading to sort items based on values in a column. Click the column heading again to switch between ascending and descending order. To sort items based on a secondary value, Shift+click another column heading. Mouse over a widget and click to expand it. Click to collapse the widget and return to the dashboard. |
| Note | Miscellaneous project information, such as instructions, links to external resources, and links to important Helix ALM items, filtered item lists, reports, folders, task boards, and dashboards. | Mouse over a widget and click to expand it. Click to collapse the widget and return to the dashboard. If the widget contains a hyperlink, click it to navigate to the item or area, or the external site. |
| Recent Activity | The 20 most recent activities performed on items in the project. | Click an activity summary to open the item. |
Tip: To update the data in a widget, mouse over it and click  . See Updating dashboard content.
Configuring dashboards
If you have permission to configure dashboards, you can edit or configure them from the Dashboards menu.
- To edit a dashboard, click Dashboards and choose Edit Current Dashboard. See Editing and deleting dashboards.
- To configure dashboards, click Dashboards and choose Configure Dashboards. See Configuring dashboards.
If a dashboard is open, it automatically refreshes every 15 minutes. You can also manually refresh dashboards to load new or changed widgets, layout changes, and current widget data. To refresh a dashboard,
You can also manually update specific widgets to show current data. When widgets are updated, the data is recalculated. For example, if you changed the status of multiple items at the same time, you can manually update a specific widget that includes those items to see the changes immediately. To update a widget, mouse over it and click .
Note: Chart widget data, including burn down and burn up charts, is cached on the server for optimized performance. When you refresh a dashboard, cached data is returned to these widgets if the data was recalculated within the past 15 minutes. To make sure a specific chart widget shows the most current data, manually update it.
Home


