Dashboard widget types
Helix ALM includes the following widgets to use on dashboards to display project information.
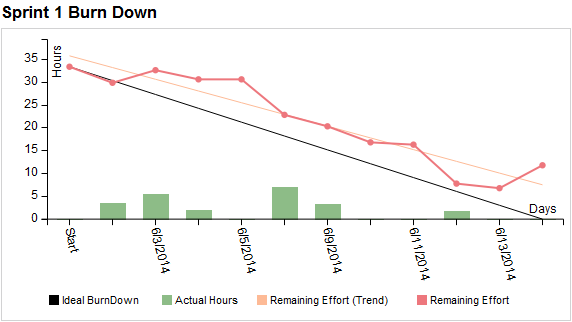
Displays the work left to do in an iteration, sprint, release, or project phase versus the total time available in the specified planning period. Use these widgets to determine if the remaining work can be completed on schedule.
See Adding dashboard burn down widgets.
A development team can use a burn down widget to make sure they complete all work hours included in a two-week sprint. As team members work on items during the sprint, they enter actual hours in workflow events. The team views the progress on the widget each morning to track the remaining estimated hours. If the remaining effort does not match the ideal burn down, the team can tell they need to do more work to meet the sprint deadline or adjust the tasks or schedule for the sprint.
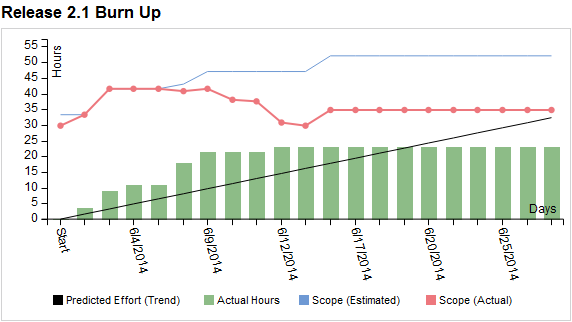
Displays the work done in an iteration, sprint, release, or project phase versus the total time available in the specified planning period. Use these widgets to determine if work is completing on schedule based on the projected progress.
See Adding dashboard burn up widgets.
A development team can use a burn up widget to track work as they complete it during a four-week release. As team members work on items during the release, they enter actual hours in workflow events. The team views the progress on the widget each morning and compares the actual versus estimated effort up to that point in the release. If the predicted remaining effort matches the ideal burn up, the team can determine if they are on schedule to complete the release on time or possibly earlier.
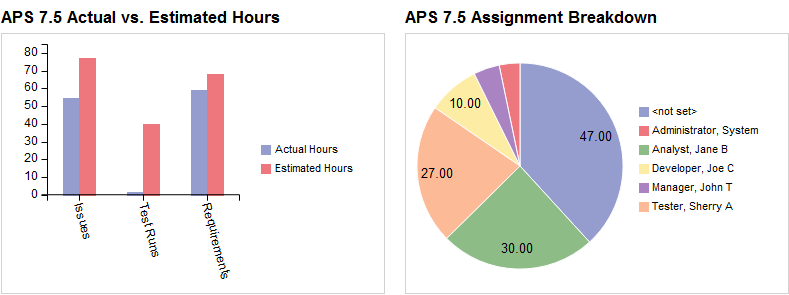
Displays graphical representations of various project data. Use these widgets to view overall project metrics and status.
See Adding dashboard chart widgets.
A development manager can use a column chart to track the actual versus estimated hours to complete a feature to help with future release planning estimates. A team lead can use a pie chart to view a breakdown of items currently assigned to users to make sure work is evenly distributed.
Displays the number of items that pass a specific filter. Use these widgets to see how many items pass the filter and go directly to a filtered list of items. Click the widget to view items that pass the filter.
See Adding dashboard count widgets.
A developer can use a High Churn Issues widget to quickly locate issues with fixes that frequently fail verification to investigate alternate fixes. A QA analyst can use a Suspect Test Cases widget to view test cases that need updates when requirements change to keep testing on schedule.

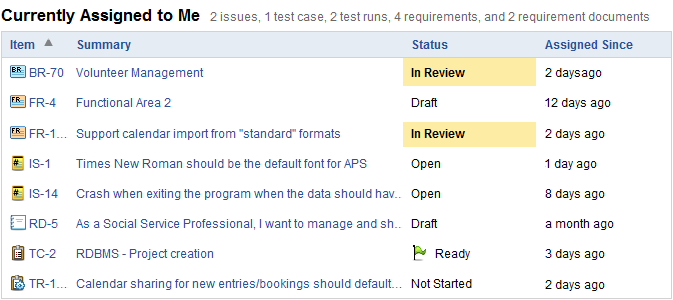
Displays items currently assigned to the logged in user. Use this widget to quickly find items to work on. Click an item tag or summary to open the item.
This is a built-in widget you can add to dashboards, but you cannot edit it or delete it from the project.
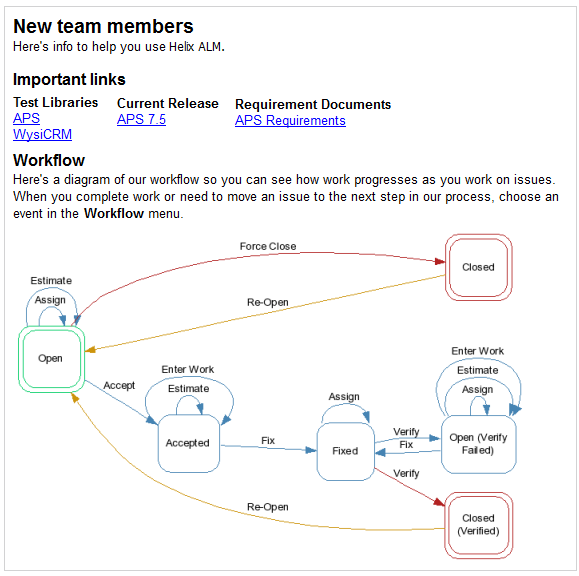
Displays miscellaneous project information, such as instructions, links to external resources, and links to important Helix ALM items, filtered item lists, reports, or dashboards. Use these widgets to learn more about the project or navigate to other information.
See Adding dashboard note widgets.
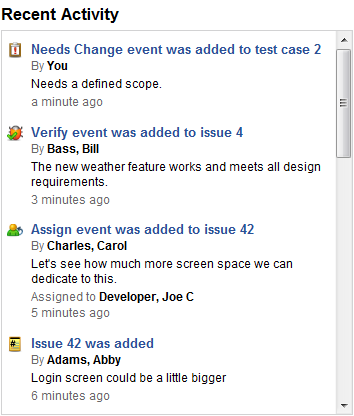
Displays the 20 most recent activities performed on items in the project. Use this widget to quickly see what items were recently added or updated. Click an activity summary to open the item.
This is a built-in widget you can add to dashboards, but you cannot edit it or delete it from the project.
