Computing the Chart Layout
The global layout of a chart is computed by a dedicated object called the layout object. When we speak about the global layout of the chart, we are referring to the position of the different areas of the chart within its bounding box. We distinguish three areas within the bounding box of a chart:
By default, the graph area and the data display area are automatically computed from the drawing area so that the graph area takes up the maximum amount of available space within the drawing area. For Cartesian charts, the graph area will be equal to the drawing area. For polar charts, the data display area must be a square. In this case, the data display area will be the largest square possible so that the corresponding graph area lies within the drawing area.
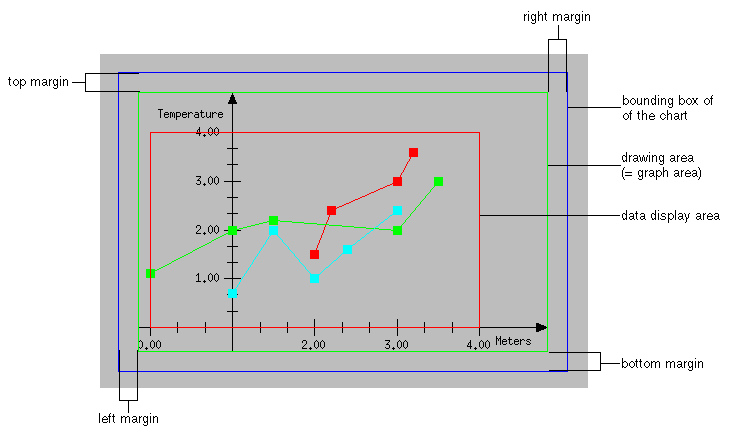
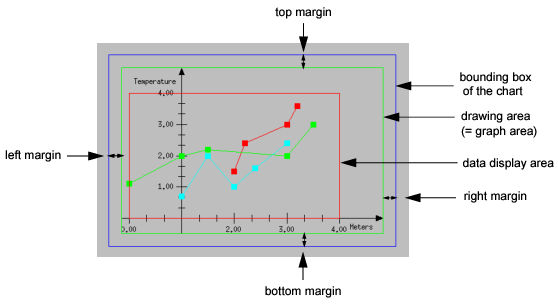
Areas within the Bounding Box of a Cartesian Chart shows an example of these areas for a Cartesian chart. The bounding box of the chart is the largest rectangle. The drawing area, graph area, and data display area are positioned within the bounding box. The drawing area and the graph area are equivalent so they appear as the same rectangle (the second largest rectangle in the figure). You can see that the graphical representations of data and the scales are all contained within the graph area. The smallest rectangle shown in the figure is the data display area. This area contains the ranges of data represented by all the scales of the chart.


Areas within the Bounding Box of a Cartesian Chart
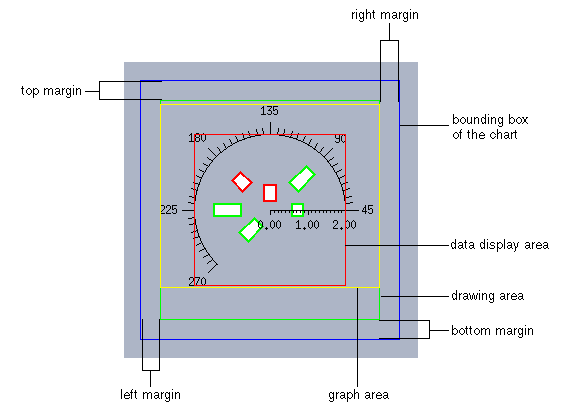
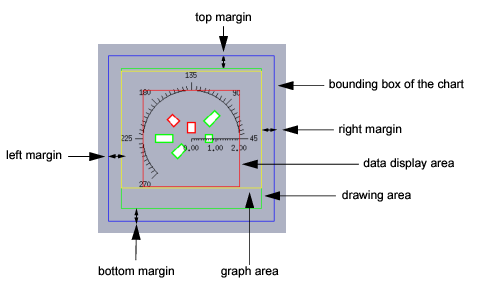
Areas within the Bounding Box of a Polar Char shows an example of these areas for a polar chart. You can notice that the drawing area is not equivalent to the graph area and that the data display area is a square.


Areas within the Bounding Box of a Polar Char
The base class used to represent a layout object is the IlvChartLayout class. No subclass is defined in the Charts Library.
Published date: 05/24/2022
Last modified date: 02/24/2022


