How Charts Work in Views
A chart object needs several different kinds of objects to display a chart. All these different objects work together in the process of converting data into a graphical display.
Components of a Chart Object
Through the examples in the section Basic Steps for Creating a Chart, you saw that a chart object uses:
In addition, a chart object uses the following objects:
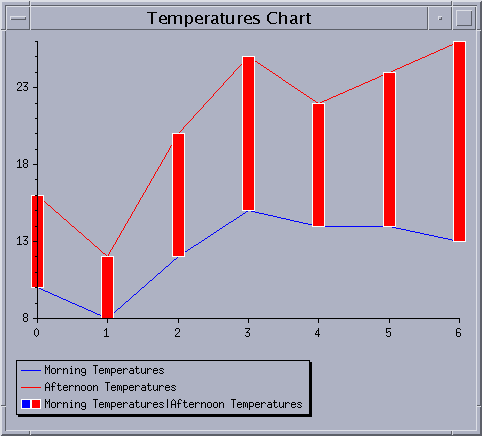
To see how all these various components work together within a chart object, let’s take a look at the Temperatures chart that we created as an example in Creating a Simple Cartesian Chart (Example of the Temperatures Chart).

Example of the Temperatures Chart
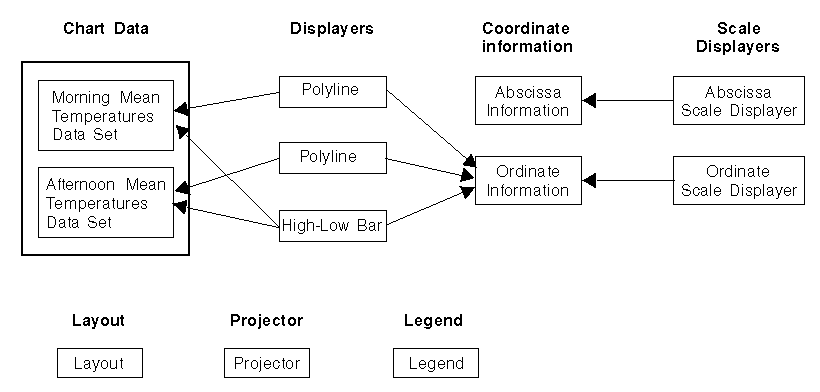
Components of the Temperatures Chart shows the objects used by the chart object to display the Temperatures Chart.


Components of the Temperatures Chart
The chart object uses the following objects to display the Temperatures Chart:
The arrows in the figure show the relationship between some of these objects. For each of the displayers (the two polylines and the high-low bar), the data set(s) it displays is indicated as well as the coordinate information object associated with the ordinate scale considered by the displayer. The coordinate information is necessary since a chart can use several ordinate scales (this means that several coordinate systems can be displayed on the same chart) and a displayer object must know which coordinate system it must use to display the data. For each of the scale displayers, the arrows indicate the coordinate information object that is associated with the coordinate represented by the scale displayer.
Published date: 05/24/2022
Last modified date: 02/24/2022


