Label | Description |
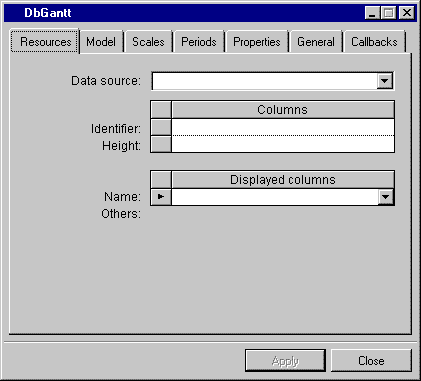
Data source | Menu: The names of current data sources. Default: None. Explanation: Name of the resources data source file to which the gantt is connected. |
Identifier column | Menu: Column names of the selected data source. Default: None. Explanation: The column name contains the resource identifier. |
Height column | Menu: Integer column names of the selected data source. Default: None. Explanation: The column name contains the resource height. |
Name displayed column | Menu: Column names of the selected data source. Default: None. Explanation: The column name contains the first name to be displayed. |
Others displayed column | Menu: Column names of the selected data source. Default: None. Explanation: Lets you specify other column names to be displayed. |

Label | Description |
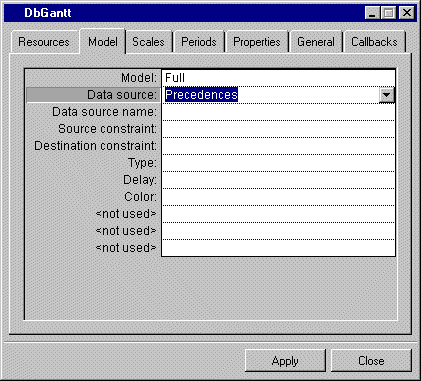
Model | Menu: Full, light. Default: Full. Explanation: The model name of the data model. |
Data source | Menu: Activities, Constraints, Precedences, Breaks, Load. Activities is only available if the selected model is Full. Default: Activities. Explanation: The datasource usages. |
Label | Description |
Data source name | Menu: The name of the current data sources. Default: None. Explanation: Name of the activities data source to which the gantt is to be connected. |
Start min | Menu: Column names of the selected data source. Default: None. Explanation: The column name contains the activity start minimum value. |
Start max | Menu: Column names of the selected data source. Default: None. Explanation: The column name contains the activity start maximum value. |
End min | Menu: Column names of the selected data source. Default: None. Explanation: The column name contains the activity end minimum value. |
End max | Menu: Column names of the selected data source. Default: None. Explanation: The column name contains the activity end maximum value. |
Identifier | Menu: Column names of the selected data source. Default: None. Explanation: The column name contains the activity identifier. |
Label | Menu: Column names of the selected data source. Default: None. Explanation: The column name contains the activity label. |

Label | Description |
Data source name | Menu: The name of the current data sources. Default: None. Explanation: Name of the constraints data source to which the gantt is to be connected. |
Identifier | Menu: Column names of the selected data source. Default: None. Explanation: The column name contains the constraint. |
Resource identifier | Menu: Column names of the selected data source. Default: None. Explanation: The column name contains the resource identifier to which the constraint is linked. |
Label | Only available if the selected mode is Light. Menu: Column names of the selected data source. Default: None. Explanation: The column name contains the constraint label. |
Activity identifier | Only available if the selected model is Full. Menu: Column names of the selected data source. Default: None. Explanation: The column name contains the activity identifier to which the constraint is linked. |
Capacity | Menu: Integer column names of the selected data source. Default: None. Explanation: The column name contains the constraint capacity. |
Foreground | Menu: String column names of the selected data source. Default: None. Explanation: The column name contains the foreground color for the costraint. |
Background | Menu: String column names of the selected data source. Default: None. Explanation: The column name contains the background color for the costraint. |
Start | Only available if the selected model is Light. Menu: Integer column names of the selected data source. Default: None. Explanation: The column name contains the constraint start value. |
End | Only available is the selected model is Light. Menu: Integer column names of the selected data source. Default: None. Explanation: Name of the precedences data source to which the gantt is to be connected. |

Label | Description |
Data source name | Menu: The names of the current data sources. Default: None. Explanation: Name of the precedences data source to which the gantt is to be connected. |
Source constraint | Menu: Column names of the selected data source. Default: None. Explanation: The column name contains the constraint identifier from which the precedences start. |
Destination constraint | Menu: Column names of the selected data source. Default: None. Explanation: The column name contains the constraint identifier to which the precedences go. |
Type | Menu: Integer column names of the selected data source. Default: None Explanation: The column name contains the precedence type. |
Delay | Menu: Integer column names of the selected data source. Default: None. Explanation: The column name contains the precedence delay. |
Color | Menu: String column names of the selected data source. Default: None. Explanation: The column name contains the color of the precedence. |

Label | Description |
Data source name | Menu: The names of the current data sources. Default: None. Explanation: Name of the breaks data source to which the gantt is to be connected. |
Identifier | Menu: Column names of the selected data source. Default: None. Explanation: The column name contains the break identifier. |
Resource identifier | Menu: Column names of the selected data source. Default: None. Explanation: The column name contains the resource identifier to which the break is linked. |
From | Menu: Integer column names of the selected data source. Default: None. Explanation: The column name contains the value where the break starts, in relation to the horizontal scale. |
To | Menu: Integer column names of the selected data source. Default: None. Explanation: The column name contains the value where the break stops, in relation to the horizontal scale. |

Label | Description |
Data source name | Menu: The names of the current data sources. Default: None. Explanation: Name of the load data source to which the gantt is to be connected. |
Resource identifier | Menu: Column names of the selected data source. Default: None. Explanation: The column name contains the resource identifier to which the work load curve is linked. |
From | Menu: Integer column names of the selected data source. Default: None. Explanation: The column name contains the value where the work load curve starts. |
To | Menu: Integer column names of the selected data source. Default: None. Explanation: The column name contains the value where the work load curve stops. |
Capacity | Menu: Integer column names of the selected data source. Default: None. Explanation: The column name contains the work load curve capacity. |

Label | Description |
Reference year | Menu: None. Default: 1998. Explanation: Reference year for the Gantt chart. |
Reference month | Menu: The months of the year. Default: January. Explanation: Reference month for the Gantt chart. |
Display full name | Menu: Yes, No. Default: Yes. Explanation: Yes = Full display of the selected reference time period. No = Short display of the selected reference time period. |
Type | Menu: Various date formats, for example: Date with week days Date by hour Week days by 30 minutes Hours and minutes Numeric. Default: Date. Explanation: Type of scale. |
Time unit | Menu: Various units of time in seconds, minutes, hours, day or numeric. Default: Day. Explanation: Unit of the time scale. |

Label | Description |
Unit column | Menu: Month, Day, Weekday, Hour, Minute, Second, Month and day, Hour and minute. Default: None. Explanation: Time unit for inactive period. |
Test column | Menu: Equal, Not equal, Less, Greater, Include, Exclude. Default: None. Explanation: Test for inactive period. |
Value 1 column | Menu: Depends on the selected unit. For example, if the selected unit is Day, the menu is Monday to Sunday; if the unit is Hour, the menu is 0 to 23. Default: None. Explanation: Value of the inactive period. |
Value 2, Value 3, Value 4 columns | Menu: Depends on the selected unit and test. Default: None. Explanation: Value of the inactive period. Ignore = There is no use for the test. |

Label | Description |
Propagate deletion event | Menu: Yes, No. Default: Yes Explanation: A deletion event in a data source deletes corresponding events in other data sources. |
Propagate update event | Menu: Yes, No. Default: Yes. Explanation: An update event in a data source updates corresponding events in other data sources. |
Read only | Menu: Yes, No. Default: No. Explanation: Yes: the Gantt chart cannot be edited: the constraints cannot be moved. No: The Gantt chart can be edited: the constraints can be moved. |
Interaction data source to gantt | Menu: Yes, No. Default: Yes. Explanation: Gantt chart is updated or not when the data source is updated or modified. |
Delimiter color | Menu: None. Click the button to open the Color Selector Dialog Box. Default: red. Explanation: Delimiter color of the constraint. |
Default precedence color | Menu: None. Click the button to open the Color Selector Dialog Box. Default: darkgreen. Explanation: Default color used for precedences if not specified in the precedences data source. |
Break color | Menu: None. Click the button to open the Color Selector Dialog Box. Default: green. Explanation: The color used for the breaks. |
Work load curve color | Menu: None. Click the button to open the Color Selector Dialog Box. Default: red. Explanation: The color used for the work load curves. |
Inactive period color | Menu: None. Click the button to open the Color Selector Dialog Box. Default: gray. Explanation: Color for the inactive periods in the Gantt chart. |
Active period color | Menu: None. Click the button to open the Color Selector Dialog Box. Default: white. Explanation: Color for the active periods in the Gantt chart. |