Loading the Base Structure Map and CADRG Files
To load the necessary files for this example, first close the buffers that are currently open. Then load the waco.ivl file:
1. Choose Load a Views File from the File menu.
2. Browse to the following location: <wacodir> and open the waco.ivl file.
The region of Waco appears in the buffer:
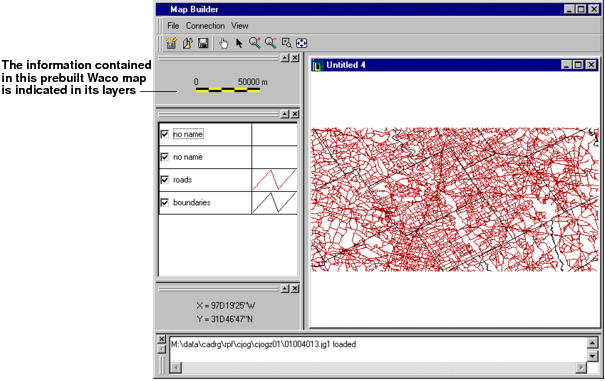
Figure 2.10 Map of Waco, Texas Loaded into the Buffer
The next file you load is the CADRG scanned map file, which is in load-on-demand mode:
1. Choose Insert Map File from the File menu.
2. Browse to the following location: <cadrgdir>/cadrg/rpf/cjog/cjogz01 and open, for example, the 01004013.jgl file.
3. In the Parameters window, select Load-on-demand in the page Load-on-Demand.
This setting specifies that the different parts of the CADRG directory that makes up an entire map will be loaded according to what the user wants to see when using the Zoom, Pan, or Fit-to-content commands. The Load-on-demand parameter setting of Rogue Wave Views Map Builder sets the load-on-demand functionality.
4. On the Scale control page, set the Large scale limit at 1/100,000 and the Small scale limit to 1/500,000.
5. Click OK.
The CADRG layer is not visible until the display is set to a scale within the limits of the visibility filter. Display the whole map using the Fit to Content icon, then zoom until you see the CADRG layer. When this layer becomes visible, it will be displayed on top of the layer containing waco.ilv. We need to reorder the layer so that the roads are on top of this CADRG layer.
Repositioning the Layers
You are now going to reposition the layers so that the layers of the vectorial map are displayed on top of the scanned map:
1. In the legend LAYER LIST, right-click the CADRG layer to open the layer visibility menu.
2. Select SEND to Back. The CADRG layer is sent to the back and the roads are now visible.
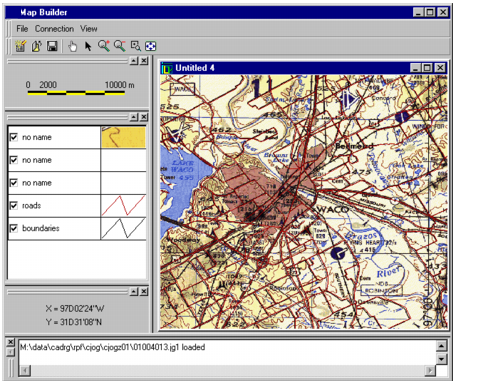
Superimposing Maps
The roads and the towns of the Waco, Texas region are perfectly superimposed. To verify this, clear the roads layer check box on the left of the Map Builder main window to hide this layer. You see the roads of the vectorial map (the base structure map) immediately underneath:
Figure 2.11 Superimposing Maps
Observing Load-on-Demand at Different Scales
To observe the load-on-demand functionality, you are going to load a file that consists of several mega bytes of data stored on a disk in a compressed format. Because of load-on-demand, you will be able to manipulate your overall map without prohibitive response times.
1. Choose Insert a Map File in the File menu.
2. Browse to the following location: <cadrgdir>/cadrg/rpf/cltm50/ct50z01 and open, for example, the Oqen2013.tl1 file.
This will simply indicate the first zone displayed for the load-on-demand.
3. In the Parameters window, on the Load-On-Demand page, select Load-On-Demand.
4. On the Scale control page, set the Small scale limit to 100,000.
5. Click OK.
The loaded layer is put on top of the drawing stack. Send it to the background using the instructions defined in
Repositioning the Layers.
Now, you can observe the load-on-demand functionality by changing the scale of the map or by moving the map in the view to display a different section of it. To do this, try the Fit-to-content, Zoom, and the Pan commands on the toolbar. You will see load-on-demand responding rapidly, displaying the information that you want to see with little or no delay.
Version 5.8
Copyright © 2014, Rogue Wave Software, Inc. All Rights Reserved.