Stacked Displayers
The base class used to represent data with a stacked graphical representation is the
IlvStackedChartDisplayer class. This type of graphical representation enables you to compare the contribution of a given data value to a total across several data sets. The type of the child displayers that are created by default is not specified at that level of the class hierarchy. However, you can define the child displayers that will be created by setting one of the following:
See
Using Composite Displayers for details on these two objects.
The Charts Library also provides several subclasses of the IlvStackedChartDisplayer class that define the child displayers created by default to be stacked: bar displayers, 3D-bar displayers, and polygon displayers.
A stacked displayer has the following basic characteristics:
Class | |
Category | Composite |
Number of real data sets displayed | As many as you want |
Can be used with all types of projections | Yes |
Number of child displayers | As many as the number of real data sets |
Subclasses | |
A stacked displayer displays as many data sets as you want. Within a stacked graphical representation, the first data set is represented at the bottom. The second data set is stacked on top of the first one. The third data set is stacked on the top of the second one, and so on.
The following property is specific to a stacked displayer:
Property | Methods | Default Value |
100% Stacked | isStacked100PerCent setStacked100PerCent | IlvFalse |
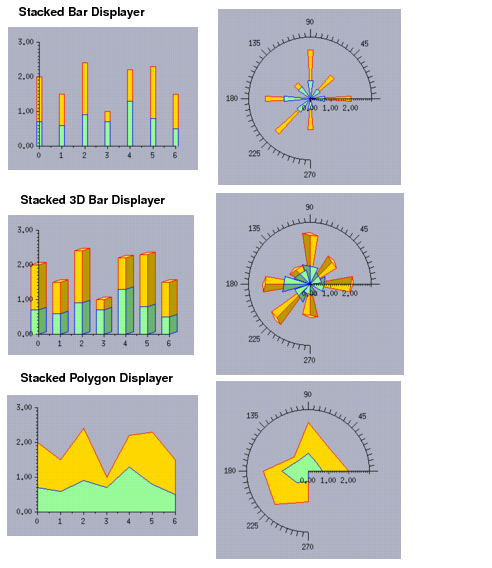
Figure 8.15 illustrates the fact that a stacked displayer can be used with all types of projections. Data sets are represented by a stacked bar displayer, a stacked 3D bar displayer, and a stacked polygon displayer in Cartesian charts (using a Cartesian projection) and in polar charts (using a polar projection).
Figure 8.15 Stacked Displayers in Cartesian Charts and in Polar Charts
We can use the stacked displayer displaying data with polygons as an example. This displayer can be created in one of the following ways:
The complete source code for creating the Cartesian chart displaying stacked data with stacked polygons can be found in the stackedpolygon.cpp file located in the $ILVHOME/samples/charts/userman/src directory. This file contains the code for each of the three ways of creating a stacked displayer.
Using a Subclass of the llvStackedChartDisplayer Class
To create the stacked displayer by using a subclass of the
IlvStackedChartDisplayer class, we can use the following code:
IlvStackedChartDisplayer* stackedDisplayer = new IlvStackedPolygonChartDisplayer(2, palettes); |
Using a Displayer Model
To create the stacked displayer by specifying a displayer model, we can use the following code:
IlvAbstractChartDisplayer* model = new IlvPolygonChartDisplayer(); IlvStackedChartDisplayer* stackedDisplayer = new IlvStackedChartDisplayer(model, 2, palettes); |
Using a Displayer Factory
To create the stacked displayer by specifying a displayer factory, we can use the following code:
PolygonDisplayerFactory* factory = new PolygonDisplayerFactory(); stackedDisplayer = new IlvStackedChartDisplayer(factory, 2, palettes); |
The following code defines the displayer factory:
class PolygonDisplayerFactory : public IlvChartDisplayerFactory { public: PolygonDisplayerFactory() : IlvChartDisplayerFactory() {} virtual IlvChartDisplayerFactory* copy() const; virtual IlvAbstractChartDisplayer* createDisplayer(IlvCompositeChartDisplayer* parent, IlvUInt idx, IlvPalette *palette); }; IlvChartDisplayerFactory* PolygonDisplayerFactory::copy() const { return new PolygonDisplayerFactory(); } IlvAbstractChartDisplayer* PolygonDisplayerFactory:: createDisplayer(IlvCompositeChartDisplayer* /* parent */, IlvUInt /* idx */, IlvPalette * palette) { return new IlvPolygonChartDisplayer(palette); } |
Version 5.8
Copyright © 2014, Rogue Wave Software, Inc. All Rights Reserved.