Example 2: Charting Analytic Functions
The example in this section is based on charting analytic functions of type y = f(x). This section is divided as follows:
Using a Data Set Defined by a Script Function
Let’s suppose you want to represent both the square and the square root functions on the same chart. To do this, you must define specific data sets.
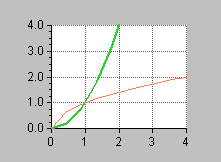
Figure 2.4 shows a chart representing these curves. The two functions are represented by different-colored polylines.
Figure 2.4 Charting the Square and Square Root Functions
This section contains the step-by-step instructions to show you how to build this chart. The procedure is broken down into several tasks, which are themselves divided into several steps.
In this part of the example, you will do the following tasks:
If you are not sure how to launch the Chart Studio or how to create a chart, read sections
Launching Rogue Wave Views Studio with the Charts Extension and
Creating a Chart Object.
Creating a Cartesian Chart
Again, the chart in this example is based on a Cartesian chart. The first thing to do is to create the chart object.
1. Drag a Cartesian chart object to your working buffer window.
2. Double-click this object.
The corresponding Chart inspector appears.
See the section
Using the Chart Inspector for an overview of the Chart inspector. This section contains an explanation of each notebook page you may need to use when working with charts.
3. At this stage, it is a good idea to save the buffer containing your chart.
Make sure you select a directory to which you have write access. Also remember to save periodically as you work.
Defining the Data Sets
You must define two data sets: one representing the square function and one representing the square root function.
Defining the Square Function Data Set
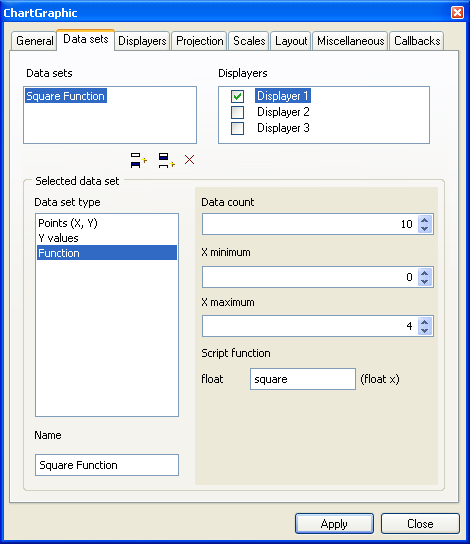
1. Click the Data sets tab in the Chart inspector to bring this page to the front.
The top of this page shows the list of data sets and the list of displayers created for the current chart. At this stage, you can either use a data set that is already defined for the current chart or create another data set by simply clicking the Insert icon

below the Data sets list.
Just remember to delete the data sets that you will not use since you only need two data sets for our example. To delete a data set, select the data set and click the Remove icon

below the Data sets list.
2. Make sure the first data set is selected in the Data sets list.
If you want to define a data set using a script function, the type of the data set must be set to the type Function. This data set type has been designed to represent analytic functions of type y = f(x). The function f is represented by a function written in the script language. This function takes a value x as its parameter and returns a computed value y. The number of data points used to represent the corresponding curve is specified by the user. These data points are computed between the interval [xmin, xmax], also specified by the user.
3. Make sure Function is selected in the Data set type list.
In the right-hand part of the “Selected data set” box, you will see several fields where you are going to enter information to define the selected data set.
4. Enter 10 in the Data count field.
This is the number of data points that will be considered for the data set.
5. Enter 0 in the “X minimum” field and 4 in the “X maximum” field.
6. Type square in the Script function field to specify the name of the script function used to define the data set.
7. Type Square Function in the Name field to change the data set name.
Before clicking Apply to validate the entries, you must define the script function.
8. Open the Script Editor by clicking the Script Editor icon

in the toolbar of the Rogue Wave Views Studio Main window.
A separate panel appears at the bottom of the Main window. This is the Script Editor.
9. Enter the following function in the Script Editor:
function square(x)
{
return x*x;
}
10. Click Apply in the Chart inspector.
The curve is represented as a straight line that is positioned at y = 0. This indicates that the function you have just written in the Script Editor has not been evaluated yet. To force evaluation just switch to Test Mode
Switching to Test Mode
Note: To have access to Test Mode, you must have loaded the GUI application plug-in. |
To force an evaluation by switching to Test Mode, do the following:
1. Click the Test icon

in the toolbar of the Rogue Wave Views Studio Main window.
A test panel opens containing your chart. In that panel, the curve of the square function is drawn correctly, which shows that the function written in the Script Editor has been evaluated.
2. Close the Test panel and return to your current working buffer window.
3. To force the redrawing of the chart, just click the chart.
You can now see the square function displayed as a curve in your regular chart.
Defining the Square-Root Function Data Set
You are going to repeat the same procedure to define the second data set and its script function. You can either use a data set that is already defined for the current chart or create another data set by simply clicking the Add icon

below the Data Sets list once the first data set is selected.
1. Select the second data set in the Data sets list.
2. Make sure Function is selected as the data set type.
The values you set for Data count, X minimum, and X maximum are the same as those you specified for the square function data set. The Data count should be 10. The X minimum should be 0. The X maximum should be 4.
3. Type squareRoot in the Script function field.
4. Type Square Root Function in the Name field to change the data set name.
5. Add the following function in the Script Editor below the previous one:
function squareRoot(x)
{
return Math.sqrt(x);
}
6. Click Apply in the Chart inspector.
7. Follow the steps described in the
Switching to Test Mode section to force an evaluation of the
squareRoot script function.
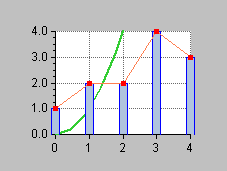
The chart should look like this:
8. You can now choose to close the Script Editor by clicking the
icon.
Defining the Displayers
After you have defined the data sets to be represented, you need to define the displayers.
1. Click the Displayers tab in the Chart inspector to bring this page to the front.
The top of this page shows the list of displayers and the list of data sets created for the current chart. At this stage, you can either use a displayer that is already defined for the current chart or create another displayer by simply clicking the Insert icon
below the Displayers list.
Just remember to delete the displayers that you will not use since you only need two displayers for our example. To delete a displayer, select the displayer and click the Remove icon
below the Displayers list.
2. Make sure the first displayer is selected in the Displayers list.
This displayer will be used to display the Square Function data set.
3. For the displayer to display the Square Function data set, the toggle in front of the Square Function data set must be checked. If it is not checked, click the toggle.
Next, you must specify the type of displayer for the data set. Because you want to represent the square function with a polyline, you must specify a polyline displayer.
4. Make sure “Polyline” is selected in the Displayer type list. If it is not selected, select “Polyline.”
5. Click Apply to validate the change.
Following the same procedure, you are now going to define the displayer for the
Square Root Function data set. You can either use a displayer that is already defined for the current chart or create another displayer by simply clicking the Add icon
below the Displayers list once the first displayer is selected.
1. Select the second displayer from the Displayers list.
2. For the displayer to display the Square Root Function data set, the toggle in front of the Square Root Function data set must be checked. If it is not checked, click the toggle.
Next, you must specify the type of displayer for the data set. Because you want to represent the square root function with a polyline, you must specify a polyline displayer.
3. Make sure “Polyline” is selected in the Displayer type list. If it is not selected, select “Polyline.”
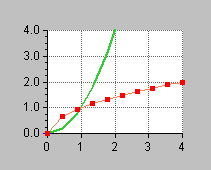
4. Click Apply to validate the change.
You can now check the resulting chart. It should look like this.
Version 5.8
Copyright © 2014, Rogue Wave Software, Inc. All Rights Reserved.