Defining a Related Ordinate Scale
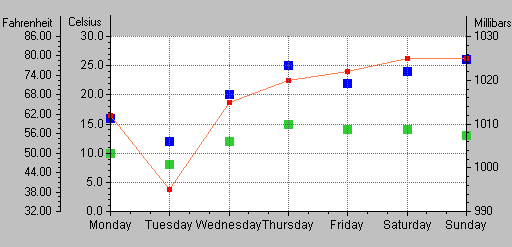
Let’s assume that now you want to add another ordinate scale to represent the temperatures so that you can show the correspondence between degrees Celsius and degrees Fahrenheit. This second temperatures scale will represent the same data as Ordinate 1, but will be graduated in degrees Fahrenheit instead of degrees Celsius.
Figure 2.2 shows the chart you will obtain when you add the Fahrenheit scale:
Figure 2.2 Defining a Related Ordinate Scale
In this part of the example, you will see how to define a transformation to be applied to the data values represented by a scale.
To define this related ordinate scale, you need to perform the following tasks:
Creating Ordinate 3 Scale
To create the Fahrenheit scale, follow the same procedure as you did to create the second ordinate scale (see
Creating Ordinate 2 Scale).
Customizing Ordinate 3 Scale
To customize the Ordinate 3 scale, you need to perform the following tasks:
Setting the Position and Min/Max Values of the Scale
On the General subpage of the Scales page, you are going to specify the position to which Ordinate 3 is attached, as well as the minimum and maximum values that will be represented on this scale.
1. In the “Scale fixed to” drop-down list, make sure that “a position” is selected. Then select or type -60 in the field next to this option.
This position is specified relative to the position of the minimum data value represented on the abscissa scale as indicated by the option “From minimum value.” Make sure this option is selected.
By default, the minimum and maximum values are computed automatically. You must therefore change the way the minimum and maximum values are defined before you can set these values.
2. Select “User-defined” in the Min/max drop-down list.
Ordinate 3 will represent the temperatures in degrees Fahrenheit. The minimum and maximum values must be the same as those set for Ordinate 1 since Ordinate 3 will represent the same data values as Ordinate 1. Ordinate 1 displays graduations in degrees Celsius while Ordinate 3 will display the corresponding values in degrees Fahrenheit.
3. Enter 0 in the Min field and 30 in the Max field, just as you did for scale Ordinate 1.
4. Click Apply to validate the changes.
Applying a Transformation
We want to represent the same data values on scale Ordinate 3 as we represented on scale Ordinate 1. However, on scale Ordinate 3, the values should be expressed in degrees Fahrenheit rather than degrees Celsius. To do this, we have to specify a transformation from degrees Celsius to degrees Fahrenheit for Ordinate Scale 3. Follow these steps:
1. Click the Transformation tab on the Scales page to bring this page to the front.
This is where you will set the transformation that will convert degrees Celsius to degrees Fahrenheit.
Converting degrees Celsius to degrees Fahrenheit is done by the following formula:
where C is a data value expressed in degrees Celsius and F is the equivalent temperature in degrees Fahrenheit.
2. Select Affine from the Elementary transformation list.
3. Enter 1.8 in the Multiplicative coefficient field and 32 in the Constant coefficient field.
4. Click Apply to validate the changes.
Setting the Scale Graduations
1. Select the Steps tab.
2. Make sure “Step number” is selected in the Step definition list.
3. Set 10 as the number of steps and 3 as the number of substeps between steps.
4. Click Apply to validate the changes.
Indicating that the Labels Must Be Drawn at the Axes Crossings
1. Click the Ticks display tab to bring this page to the front.
2. Check the toggle “Draw labels on axes crossings” by clicking it.
3. Click Apply to validate the changes.
Labeling the Axis
1. Select the Axis display page.
2. In the Axis label box, type Fahrenheit in the Label text field.
3. Click Apply to validate the changes.
At this point, your chart should look like the following figure. Now, you can read a given temperature value either in degrees Celsius or in degrees Fahrenheit.
Version 5.8
Copyright © 2014, Rogue Wave Software, Inc. All Rights Reserved.