Layout Page
The Layout page lets you define the global layout of the chart (that is, the position of the different areas of the chart within its bounding box). There are three areas within the bounding box of the chart.

The
drawing area is the area where the drawing is performed. All the graphical elements that make up a chart (that is, the graphical representations of data, scales, grids and cursors) are drawn within this area. The drawing area is defined by margins relative to the bounding box of the chart.
The
data display area is the area where the data are displayed: no data points can be displayed outside of this area. This area lies inside the drawing area.
The
graph area that represents the extent of all the graphical elements that make up a chart (that is, all the graphical representations of data, scales, grids and cursors of the chart). This area lies inside the drawing area and contains the data display area.
For more details on the chart layout, see
Chart Layout.
Figure 1.11 and
Figure 1.12 show examples of these areas for a Cartesian chart and a polar chart.
Figure 1.11 Areas within the Bounding Box of a Cartesian Chart
Figure 1.12 Areas within the Bounding Box of a Polar Chart
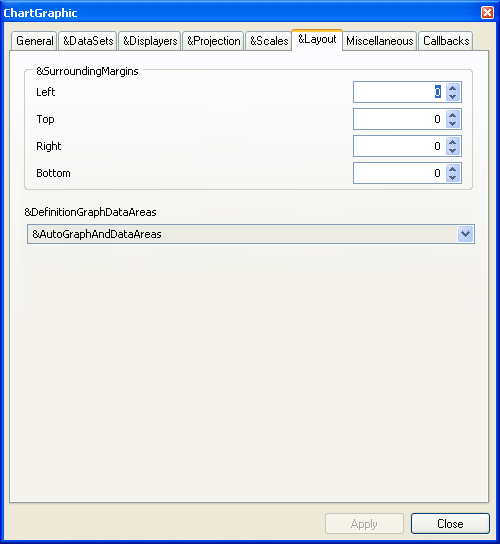
The Layout page appears as follows:
Figure 1.13 Chart Inspector: Layout Page
On this page, you can do the following:
Define the drawing area. The drawing area is defined by specifying the margins from the left, right, top, and bottom sides of the bounding box.
Define the graph area and the data display area. The graph area and the data display area can be either automatically computed or fixed to a given position.
If “Automatic” is selected, the graph area and the data display area are automatically computed from the drawing area so that the graph area takes up the maximum amount of available space.
If “Fixed graph area” is selected, the graph area is positioned with relative margins from the drawing area and the data display area is automatically computed from the graph area.
If “Fixed data display area” is selected, the data display area is positioned with relative margins from the drawing area and the graph area is automatically computed from the data display area.
Version 5.8
Copyright © 2014, Rogue Wave Software, Inc. All Rights Reserved.