How Displayer Objects Draw the Graphical Display
The drawing of the graphical representations of data is performed by the displayer objects. In order to draw a graphical representation of the data, a displayer needs to have the data points of the data set(s) it is going to display expressed in screen coordinates.
Transforming Data Points into Screen Coordinates
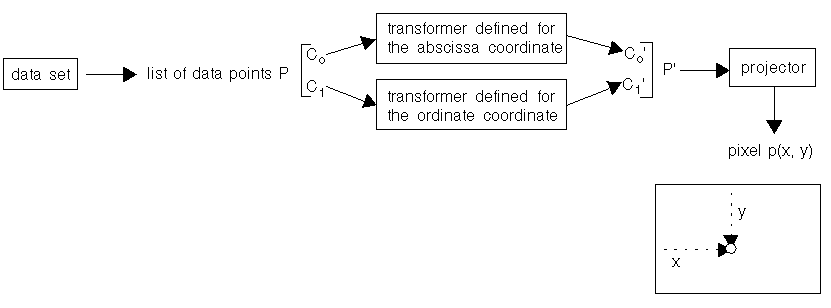
Figure 5.16 illustrates how the data points represented by a given data set are transformed into screen coordinates.
1. From a given data set, we get the data points in the form P(C0, C1) that are represented by the data set. C0 is the abscissa value and C1 the ordinate value of the data point.
2. Each data point P is transformed into P' by applying the transformer defined for the abscissa coordinate to its abscissa value C0 and the transformer defined for the ordinate coordinate to its ordinate value C1. These transformers are stored in the coordinate information objects associated with the abscissa and the ordinate scales considered by the displayer to display the data set. The same abscissa coordinate information object is used by all the displayers since the chart uses only one abscissa scale. The ordinate coordinate information object that must be used by a given displayer is stored in this displayer (in the form of a pointer).
Figure 5.16 Transforming Data Points into Screen Coordinates
Projecting Transformed Data Points into Screen Coordinates
To project the transformed data points into screen coordinates (see
step 3 on page 124), the projector needs the following information:

The area on the screen where the data points are to be displayed. This is called the
data display area and is specified by the layout object.

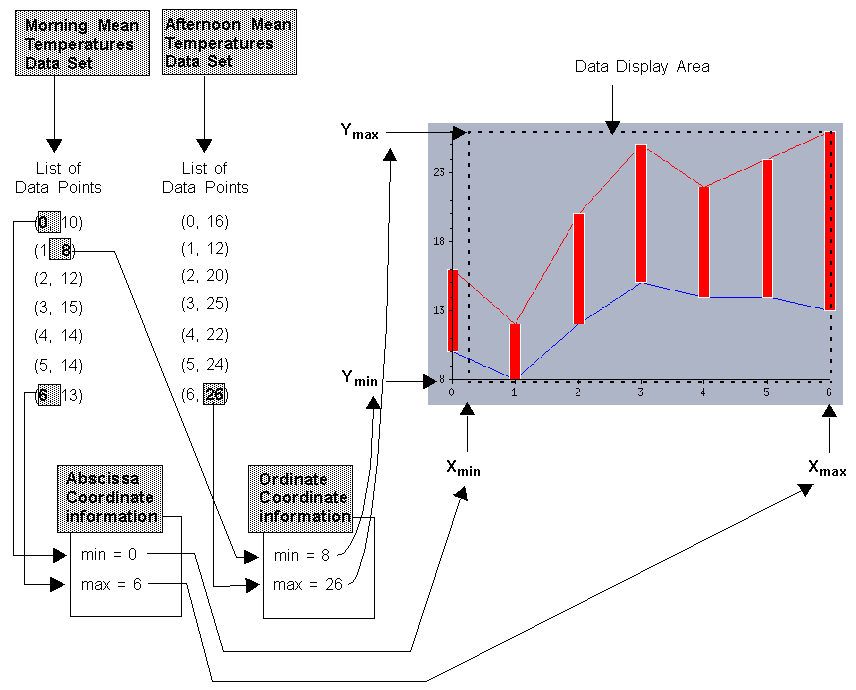
The minimum and maximum data values represented by the abscissa and the ordinate scales that are considered by the displayer to display the data. The minimum and maximum data values are the lower and upper bounds of the data points that will be projected into screen coordinates. These values are stored in the coordinate information objects associated with the abscissa and ordinate scales.
Using this information, the projector then maps the transformed data points into screen coordinates so that the data points occupy the largest amount of space within the data display area.
Figure 5.17 illustrates these concepts. (Once again, we are using our Temperatures Chart as an example.) Our chart uses one abscissa scale and one ordinate scale. Therefore, all of the displayers consider the same ordinate scale when displaying the data. By default, the minimum and maximum data values that are considered for the abscissa and ordinate scales of the chart are automatically computed so that all the data points can be displayed. For the abscissa scale, these values correspond to the minimum and maximum abscissa values in the lists of data points of the morning and afternoon mean temperatures data sets. For the ordinate scale, these values correspond to the minimum and maximum ordinate values in the lists of data points of the morning and afternoon mean temperatures data sets.
Figure 5.17 Mapping the Temperatures Data into Screen Coordinates
Version 5.8
Copyright © 2014, Rogue Wave Software, Inc. All Rights Reserved.


