
Rogue Wave Views 5.5.1
Rogue Wave Views
Charts Package API Reference Guide
Rogue Wave Views
Documentation Home
Rogue Wave Views 5.5.1 |
Rogue Wave Views |
Rogue Wave Views Documentation Home |
Class for polygon displayers. More...
#include <ilviews/charts/polyline.h>
Public Member Functions | |
| IlvPolygonChartDisplayer (IlvPalette *palette=0) | |
| Constructor. | |
| virtual IlvAbstractChartDisplayer * | copy () const |
| Virtual copy constructor. | |
| virtual void | drawLegendItem (IlvPort *dst, const IlvRect &legendArea, IlvPalette *itemPal, const IlvRegion *clip, IlAny clientData=0) const |
| Draws the graphic part of a legend item associated with the current displayer. | |
| virtual IlBoolean | isFilled () const |
| Indicates whether the graphical representation is filled. | |
Protected Member Functions | |
| virtual void | boundingBoxOfPoints (IlvChartDisplayerPoints *dispPts, IlvRect &bbox, IlBoolean takeInfoIntoAccount=IlTrue, const IlvTransformer *t=0) const |
| Returns the bounding box of the graphical representation from points in screen coordinates corresponding to the data points to display. | |
| virtual void | drawItem (const IlvChartDisplayerPoints *dispPts, IlUInt pointIndex, IlUInt pointCount, IlvPoint *points, IlvPalette *itemPalette, IlvPort *dst, const IlvTransformer *t=0, const IlvRegion *clip=0) const |
| Draws the item for a given point in screen coordinates corresponding to a data point to display. | |
| virtual void | drawPoints (IlvChartDisplayerPoints *dispPts, IlvPort *dst, const IlvTransformer *t=0, const IlvRegion *clip=0) const |
| Draws the graphical representation from points in screen coordinates corresponding to the data points to display. | |
| virtual IlvDoublePoint * | selectDataPointsForPoint (IlUInt dataPointIndex, IlUInt &count, IlUInt *&dataPointIndexes) const |
| Selects and returns the data points needed to display the graphical representation of the data points at a given index in the real data set(s) to be displayed by the current displayer. | |
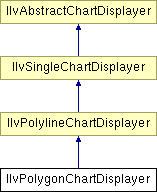
Class for polygon displayers.
Library: ilvcharts
This class is a subclass of IlvPolylineChartDisplayer which allows you to represent data with a polygon.
The polygon displayer displays a unique data set. This displayer can be used with any type of projection. (See the IlvAbstractProjector class for more details.)
The following images show data sets represented with polygon displayers in a Cartesian chart (on the left) and a polar chart (on the right).
IlvPolylineChartDisplayer. | IlvPolygonChartDisplayer::IlvPolygonChartDisplayer | ( | IlvPalette * | palette = 0 |
) |
Constructor.
Initializes a new IlvPolygonChartDisplayer object.
| palette | The palette that will be used to display the polygon. |
| virtual void IlvPolygonChartDisplayer::boundingBoxOfPoints | ( | IlvChartDisplayerPoints * | dispPts, | |
| IlvRect & | bbox, | |||
| IlBoolean | takeInfoIntoAccount = IlTrue, |
|||
| const IlvTransformer * | t = 0 | |||
| ) | const [protected, virtual] |
Returns the bounding box of the graphical representation from points in screen coordinates corresponding to the data points to display.
(See the IlvSingleChartDisplayer::boundingBoxOfPoints method for more details.)
This method first computes the two points that are added to the points in screen coordinates that correspond to the data points to display in order to close the polygon. (See the IlvPolygonChartDisplayer::drawPoints method for more details about this calculation.) These two points are added to the points stored in dispPts. The method then calls the IlvSingleChartDisplayer::boundingBoxOfPoints method with the dispPts object that has been modified as a parameter.
Reimplemented from IlvSingleChartDisplayer.
| virtual IlvAbstractChartDisplayer* IlvPolygonChartDisplayer::copy | ( | ) | const [virtual] |
Virtual copy constructor.
Creates and returns a copy of the current object. This method must be overloaded in subclasses. It is automatically declared by the DeclareChartDisplayerTypeInfo macro. The IlvPredefinedChartDisplayerIOMembers macro lets you define a default implementation, which returns an instance initialized with the copy constructor.
Reimplemented from IlvPolylineChartDisplayer.
| virtual void IlvPolygonChartDisplayer::drawItem | ( | const IlvChartDisplayerPoints * | dispPts, | |
| IlUInt | pointIndex, | |||
| IlUInt | pointCount, | |||
| IlvPoint * | points, | |||
| IlvPalette * | itemPalette, | |||
| IlvPort * | dst, | |||
| const IlvTransformer * | t = 0, |
|||
| const IlvRegion * | clip = 0 | |||
| ) | const [protected, virtual] |
Draws the item for a given point in screen coordinates corresponding to a data point to display.
Draws the item for the point in screen coordinates that is stored at the index pointIndex in the dispPts object. This object stores the points in screen coordinates corresponding to the data points that have to be displayed by the current displayer. (See the IlvSingleChartDisplayer::drawItem method for more details.)
This method is used only one time (and not for each screen point) to draw the whole polygon. The points defining the extremities of the polygon are stored in points. A polyline is drawn between the extremities of the polygon with the foreground color of the palette itemPalette. The polygon is filled with the background color of the palette itemPalette if the method IlvSingleChartDisplayer::isDrawingFill returns IlTrue.
drawPoints method. Reimplemented from IlvPolylineChartDisplayer.
| virtual void IlvPolygonChartDisplayer::drawLegendItem | ( | IlvPort * | dst, | |
| const IlvRect & | legendArea, | |||
| IlvPalette * | itemPal, | |||
| const IlvRegion * | clip, | |||
| IlAny | clientData = 0 | |||
| ) | const [virtual] |
Draws the graphic part of a legend item associated with the current displayer.
The current method simply calls the IlvSingleChartDisplayer::drawLegendItem method. (See the IlvSingleChartDisplayer::drawLegendItem method for more details.)
| dst | The port used for the drawing. | |
| legendArea | The area where the drawing is performed. | |
| itemPal | The palette of the legend item associated with the current displayer. | |
| clip | The optional clipping region. | |
| clientData | The client data defined for the legend item associated with the current displayer. |
Reimplemented from IlvPolylineChartDisplayer.
| virtual void IlvPolygonChartDisplayer::drawPoints | ( | IlvChartDisplayerPoints * | dispPts, | |
| IlvPort * | dst, | |||
| const IlvTransformer * | t = 0, |
|||
| const IlvRegion * | clip = 0 | |||
| ) | const [protected, virtual] |
Draws the graphical representation from points in screen coordinates corresponding to the data points to display.
(See the IlvSingleChartDisplayer::drawPoints method for more details.)
This method first computes the two points that are added to the points in screen coordinates that correspond to the data points to display in order to close the polygon. These two points are computed from the first and the last points stored in dispPts. They are located on the abscissa scale in Cartesian charts. They are both on the center of the data display area in polar charts. (These points correspond to the points marked with white circles in the preceding figure.) These two points are added to the points stored in dispPts.
The method computeItem is used for each point in screen coordinates that is stored in dispPts to compute the item that will be displayed for the screen point. The method computeItem returns the current screen point and the following point stored in dispPts, thus allowing the definition of a segment bounding the polygon to display. To improve the drawing performance, the IlvPolygonChartDisplayer::drawItem is called only one time (and not for each screen point) to draw the whole polygon.
The IlvSingleChartDisplayer::drawPointInfos method is used to draw the point information (if any).
Reimplemented from IlvPolylineChartDisplayer.
| virtual IlBoolean IlvPolygonChartDisplayer::isFilled | ( | ) | const [virtual] |
Indicates whether the graphical representation is filled.
A graphical representation is filled for a given data point if it is not only located around this data point but also if it extends towards the origin. This is the case for displayers representing data with a polygon. The polygon is bounded by the data point positions and is drawn to the abscissa scale in Cartesian charts and to the center of the data display area in polar charts. The following figure shows an example. The screen points corresponding to data points to display are represented by black squares.
IlTrue by default.
Reimplemented from IlvAbstractChartDisplayer.
| virtual IlvDoublePoint* IlvPolygonChartDisplayer::selectDataPointsForPoint | ( | IlUInt | dataPointIndex, | |
| IlUInt & | count, | |||
| IlUInt *& | dataPointIndexes | |||
| ) | const [protected, virtual] |
Selects and returns the data points needed to display the graphical representation of the data points at a given index in the real data set(s) to be displayed by the current displayer.
(See the IlvSingleChartDisplayer::selectDataPointsForPoint method for more details.)
For a displayer displaying a data set with a polyline, the data points that are selected to be able to draw the graphical representation for a data point at a given index of the data set are the following: the data point at the index dataPointIndex plus the data point at the index before (if it exists), and the data point at the index after (if it exists). These selected data points allow the part of the polyline passing through the considered data point at the given index to be drawn.
Reimplemented from IlvPolylineChartDisplayer.
© Copyright 2012, Rogue Wave Software, Inc. All Rights Reserved.
Rogue Wave is a registered trademark of Rogue Wave Software, Inc. in the United States and other countries. All other trademarks are the property of their respective owners.