Rogue Wave Views 5.5.1
Rogue Wave Views
Charts Package API Reference Guide
Rogue Wave Views
Documentation Home
 Rogue Wave Views 5.5.1 |
Rogue Wave Views |
Rogue Wave Views Documentation Home |
Implementation of predefined pie charts. More...
#include <ilviews/charts/simplegr.h>

Public Member Functions | |
| IlvPieChartGraphic (IlvDisplay *display, const IlvRect &bbox, IlDouble startingAngle=0., IlDouble range=360., IlDouble centerRatio=0., IlvPalette *palette=0) | |
| Constructor. | |
| IlvPieChartDisplayer * | addPieDisplayer (IlvChartDataSet *dataSet, IlDouble radiusRatio=1., IlvPalette *palette=0) |
| Creates and adds a pie displayer. | |
| virtual void | draw (IlvPort *dst, const IlvTransformer *t=0, const IlvRegion *givenClip=0) const |
| Draws the current object. | |
| IlDouble | getCenterRatio () const |
| Returns the ratio of the center part relative to the data display area. | |
| IlvPieChartDisplayer * | getPieDisplayer (IlUInt index) const |
| Returns a given pie displayer. | |
| IlDouble | getRange () const |
| Returns the range of the pie(s). | |
| IlDouble | getStartingAngle () const |
| Returns the angle at which the first slice of the pie(s) is drawn. | |
| IlBoolean | isUsingAutoRadius () const |
| Indicates whether the radius of the pie(s) is automatically computed. | |
| void | setCenterRatio (IlDouble ratio) |
| Sets the ratio of the center part relative to the data display area. | |
| void | setRange (IlDouble range) |
| Sets the angle range of the pie(s). | |
| void | setStartingAngle (IlDouble angle) |
| Sets the angle at which the first slice of the pie(s) is drawn. | |
| void | useAutoRadius (IlBoolean b) |
| Specifies whether the radius of the pie(s) is automatically computed. | |
Protected Member Functions | |
| virtual IlvPieChartDisplayer * | createPieDisplayer (IlDouble radiusRatio, IlDouble startingAngle, IlDouble range) const |
| Creates a new pie displayer. | |
Implementation of predefined pie charts.
Library: ilvcharts
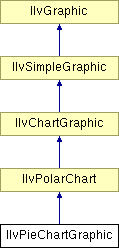
This class is a subclass of IlvPolarChart which allows you to display a chart made of one or several pies centered on the same point.
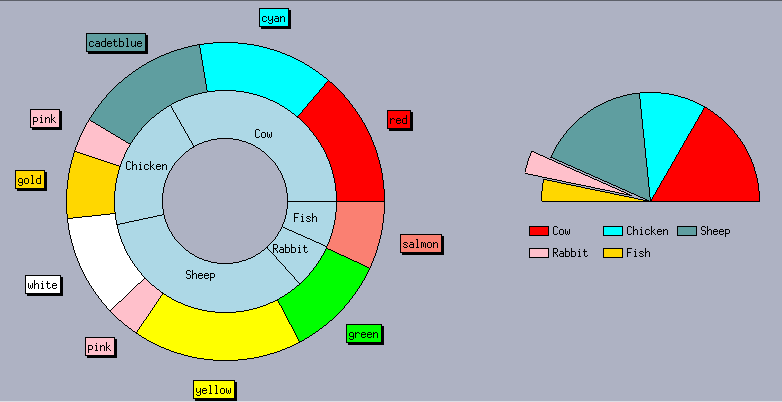
The pies centered on the same point can be displayed with a center part as you can see on the left in the image below. The center part is made of a circle drawn with the foreground color of the palette of the chart and filled with the background color of the palette of the chart.
Two examples of pie charts are shown below. The pie chart on the left is made of two pies (displayed by two pie displayers) and a center part. The pie chart on the right is made of only one pie (displayed by a pie displayer).

IlvPolarChart. | IlvPieChartGraphic::IlvPieChartGraphic | ( | IlvDisplay * | display, | |
| const IlvRect & | bbox, | |||
| IlDouble | startingAngle = 0., |
|||
| IlDouble | range = 360., |
|||
| IlDouble | centerRatio = 0., |
|||
| IlvPalette * | palette = 0 | |||
| ) |
Constructor.
Initializes a new IlvPieChartGraphic object. The flag indicating whether the radius of the pie(s) is automatically computed is set to IlTrue by default.
| display | The display connection that will handle the drawing of this object. | |
| bbox | The initial bounding box of the chart graphic. | |
| startingAngle | The angle at which the first slice of the pie(s) will be drawn. | |
| range | The angle range covered by the slices of the pie(s). | |
| centerRatio | The ratio of the center part relative to the data display area. This value must be between 0 and 1. If it is equal to 0, no center part will be drawn. | |
| palette | The palette associated with the chart. |
IlvPieChartGraphic::addPieDisplayer method. | IlvPieChartDisplayer* IlvPieChartGraphic::addPieDisplayer | ( | IlvChartDataSet * | dataSet, | |
| IlDouble | radiusRatio = 1., |
|||
| IlvPalette * | palette = 0 | |||
| ) |
Creates and adds a pie displayer.
The pie displayer that is added is created inside this method by calling the IlvPieChartGraphic::createPieDisplayer method.
| dataSet | The data set that will be displayed by the new pie displayer. | |
| radiusRatio | The ratio of the radius of the pie relative to the ordinate range of the chart graphic. This value must be between 0 and 1. This value will be taken into account only if the flag indicating whether the radius of the pie(s) is automatically computed is equal to IlFalse. | |
| palette | The palette that will be used by the pie displayer. |
IlTrue (see the method IlvPieChartGraphic::isUsingAutoRadius), the radius of all the pie displayers that are defined is automatically recomputed. The radius are recomputed so that the visible portion of the pies takes all the available space in the data display area once the space taken by the center part has been removed and so that the visible portion of the pies has the same width. | virtual IlvPieChartDisplayer* IlvPieChartGraphic::createPieDisplayer | ( | IlDouble | radiusRatio, | |
| IlDouble | startingAngle, | |||
| IlDouble | range | |||
| ) | const [protected, virtual] |
Creates a new pie displayer.
| radiusRatio | The ratio of the radius of the pie relative to the ordinate range of the chart graphic. This value must be between 0 and 1. | |
| startingAngle | The angle at which the first slice will be drawn for the pie. | |
| range | The angle range of the pie. |
IlvPieChartGraphic::addPieDisplayer method to create the pie displayer that is added to the current object. | virtual void IlvPieChartGraphic::draw | ( | IlvPort * | dst, | |
| const IlvTransformer * | t = 0, |
|||
| const IlvRegion * | givenClip = 0 | |||
| ) | const [virtual] |
Draws the current object.
The current implementation of the method calls the IlvPolarChart::draw method to draw the chart graphic (including all the pie displayers that have been added) and then draws the center part if the center ratio is different from 0. The center part is made of a circle drawn with the foreground color of the palette of the chart and filled with the background color of the palette of the chart. The drawing is performed in the port dst using the transformer t and the clipping region clip.
| dst | The port used for the drawing. | |
| t | The optional transformer. | |
| clip | The optional clipping region. |
Reimplemented from IlvChartGraphic.
| IlDouble IlvPieChartGraphic::getCenterRatio | ( | ) | const |
Returns the ratio of the center part relative to the data display area.
| IlvPieChartDisplayer* IlvPieChartGraphic::getPieDisplayer | ( | IlUInt | index | ) | const |
Returns a given pie displayer.
| index | The index of a pie displayer that has been added to the current object. |
| IlDouble IlvPieChartGraphic::getRange | ( | ) | const |
| IlDouble IlvPieChartGraphic::getStartingAngle | ( | ) | const |
Returns the angle at which the first slice of the pie(s) is drawn.
setStartingAngle. | IlBoolean IlvPieChartGraphic::isUsingAutoRadius | ( | ) | const |
Indicates whether the radius of the pie(s) is automatically computed.
IlTrue if the radius of the pie(s) is automatically computed and IlFalse otherwise. | void IlvPieChartGraphic::setCenterRatio | ( | IlDouble | ratio | ) |
Sets the ratio of the center part relative to the data display area.
| ratio | The new ratio of the center part relative to the data display area. This value must be between 0 and 1. |
| void IlvPieChartGraphic::setRange | ( | IlDouble | range | ) |
Sets the angle range of the pie(s).
This range corresponds to the sum of the angles of the slices. If range is equal to 360 degrees, the slices will cover a whole circle.
| range | The new angle range of the pie(s). The angle range must be expressed in degrees. |
| void IlvPieChartGraphic::setStartingAngle | ( | IlDouble | angle | ) |
Sets the angle at which the first slice of the pie(s) is drawn.
| angle | The new angle at which the first slice of the pie(s) is drawn. |
| void IlvPieChartGraphic::useAutoRadius | ( | IlBoolean | b | ) |
Specifies whether the radius of the pie(s) is automatically computed.
| b | The new value of the Boolean indicating whether the radius of the pie(s) is automatically computed. |
© Copyright 2012, Rogue Wave Software, Inc. All Rights Reserved.
Rogue Wave is a registered trademark of Rogue Wave Software, Inc. in the United States and other countries. All other trademarks are the property of their respective owners.