
Rogue Wave Views 5.5.1
Rogue Wave Views
Charts Package API Reference Guide
Rogue Wave Views
Documentation Home
Rogue Wave Views 5.5.1 |
Rogue Wave Views |
Rogue Wave Views Documentation Home |
Allows you to annotate data points with labels displaying the values of the data points. More...
#include <ilviews/charts/data.h>
Public Types | |
| enum | AnnotationMode { YValue, XValue, XYValues } |
Available annotation modes. More... | |
Public Member Functions | |
| IlvChartDataPointLabel (IlvDisplay *display, IlvPos dx=0, IlvPos dy=0, IlvPosition position=IlvCenter, AnnotationMode mode=IlvChartDataPointLabel::YValue, const char *format="%g", IlvPalette *pal=0) | |
| Constructor. | |
| virtual IlBoolean | boundingBox (const IlvPoint &point, const IlvChartDataSet *dataSet, IlUInt ptidx, const IlvChartGraphic *chart, IlvRect &bbox, const IlvTransformer *t=0) const |
| Returns the bounding box of the graphical information drawn next to the representation of the data point. | |
| virtual void | draw (const IlvPoint &point, const IlvChartDataSet *dataSet, IlUInt ptidx, const IlvChartGraphic *chart, IlvPort *dst, const IlvTransformer *t=0, const IlvRegion *clip=0) const |
| Draws some graphical information next to the representation of the data point. | |
| const char * | getAnnotationFormat () const |
| Returns the format used to translate data values into labels. | |
| AnnotationMode | getAnnotationMode () const |
| Returns the annotation mode. | |
| void | setAnnotationFormat (const char *f) |
| Sets the format used to translate data values into labels. | |
| void | setAnnotationMode (AnnotationMode mode) |
| Sets the annotation mode. | |
Allows you to annotate data points with labels displaying the values of the data points.
Library: ilvcharts
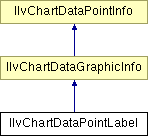
This class is a subclass of IlvChartDataGraphicInfo that allows you to annotate data points with labels displaying the values of the data points.
IlvChartDataGraphicInfo, IlvPointInfoCollection. Available annotation modes.
This enumeration type indicates how data points are annotated.
| IlvChartDataPointLabel::IlvChartDataPointLabel | ( | IlvDisplay * | display, | |
| IlvPos | dx = 0, |
|||
| IlvPos | dy = 0, |
|||
| IlvPosition | position = IlvCenter, |
|||
| AnnotationMode | mode = IlvChartDataPointLabel::YValue, |
|||
| const char * | format = "%g", |
|||
| IlvPalette * | pal = 0 | |||
| ) |
Constructor.
Initializes a new IlvChartDataPointLabel object.
| display | The display connection that will handle the drawing of the label annotation. | |
| dx | The x-offset that is used to draw the label annotation from the projected data point. | |
| dy | The y-offset that is used to draw the label annotation from the projected data point. | |
| position | The position that specifies which point of the bounding box of the label annotation should be used as a reference. | |
| mode | The annotation mode. | |
| format | The format used to translate data values into labels. | |
| palette | The palette that is used to draw the data point. |
| virtual IlBoolean IlvChartDataPointLabel::boundingBox | ( | const IlvPoint & | point, | |
| const IlvChartDataSet * | dataSet, | |||
| IlUInt | ptidx, | |||
| const IlvChartGraphic * | chart, | |||
| IlvRect & | bbox, | |||
| const IlvTransformer * | t = 0 | |||
| ) | const [virtual] |
Returns the bounding box of the graphical information drawn next to the representation of the data point.
Returns the bounding box of the stored graphic object.
| point | The coordinates of the projected data point. | |
| dataSet | The data set holding the considered data point. | |
| ptidx | The index of the considered data point in the dataSet dataSet. | |
| chart | The chart object for which the graphical information is drawn. | |
| bbox | The returned bounding box. | |
| t | The applied transformer. |
IlTrue if the bounding box has been successfully computed and IlFalse otherwise. Reimplemented from IlvChartDataGraphicInfo.
| virtual void IlvChartDataPointLabel::draw | ( | const IlvPoint & | point, | |
| const IlvChartDataSet * | dataSet, | |||
| IlUInt | ptidx, | |||
| const IlvChartGraphic * | chart, | |||
| IlvPort * | dst, | |||
| const IlvTransformer * | t = 0, |
|||
| const IlvRegion * | clip = 0 | |||
| ) | const [virtual] |
Draws some graphical information next to the representation of the data point.
Draws the stored graphic object with respect to the projected data point given by point.
| point | The coordinates of the projected data point. | |
| dataSet | The data set holding the considered data point. | |
| ptidx | The index of the considered data point in the dataSet dataSet. | |
| chart | The chart object for which the graphical information is drawn. | |
| dst | The port where the graphical representation is drawn. | |
| t | The transformer applied to dst. | |
| clip | The clipping region. |
Reimplemented from IlvChartDataGraphicInfo.
| const char* IlvChartDataPointLabel::getAnnotationFormat | ( | ) | const |
Returns the format used to translate data values into labels.
| AnnotationMode IlvChartDataPointLabel::getAnnotationMode | ( | ) | const |
Returns the annotation mode.
| void IlvChartDataPointLabel::setAnnotationFormat | ( | const char * | f | ) |
Sets the format used to translate data values into labels.
| f | The new format used to translate data values into labels. |
| void IlvChartDataPointLabel::setAnnotationMode | ( | AnnotationMode | mode | ) |
Sets the annotation mode.
| mode | The new annotation mode. |
© Copyright 2012, Rogue Wave Software, Inc. All Rights Reserved.
Rogue Wave is a registered trademark of Rogue Wave Software, Inc. in the United States and other countries. All other trademarks are the property of their respective owners.