Perforce JViews TGO Sample: JSF Integration - Monitoring
Description
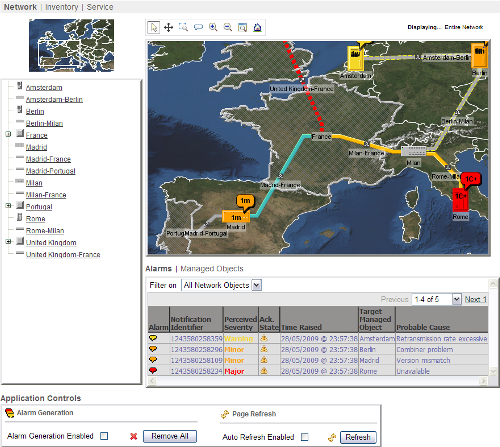 |
This sample shows how to create a web-based Operations Support System (OSS) console using the JViews TGO and MyFaces faces component sets.
How to Use the Sample
-
Module Navigation
Click the appropriate tab in the upper-left set of tabs to switch between the Network, Inventory and Service Modules.
-
Main Resource View
-
View Controls Area
-
Toolbar
-
 Click this button to enable the selection of objects in the Main View.
 -
 Click this button to enable panning in the Main View in different directions.
 -
 Click this button to zoom in on the Main View to see a more detailed view of a smaller area of the network.
 -
 Click this button to zoom out on the Main View to see a less detailed view of the network but a larger area.
 -
 Click this button to display the entire geographic map with all the network equipment at the current level.
 -
 Click this button to show or hide the Overview for the Main View in the Main View Controls area.
 -
 (Network Module only)
Click this button to have the Main View display the topmost hierarchical level of the network and the equipments
that are considered to have no enclosing entity.
(Network Module only)
Click this button to have the Main View display the topmost hierarchical level of the network and the equipments
that are considered to have no enclosing entity.
-
-
Overview
The Overview for the Main View allows users to see a small region of the network with low resolution. Drag the selection rectangle in the Overview to drive the display of different regions in the Main View.
-
Toolbar
-
Main View
In addition to the different interactions enabled by the different toolbar buttons, the Main View provides a contextual menu (pop-up menu). The following are the possible menu options triggered by the standard mouse right-click, listed per Module:-
All Modules:
-


 Show XXX Module - Always available. It navigates to the specified module.
-
-
Network Module:
-
 Show Details - Available when clicking managed objects that have additional details that can be displayed.
It either shows the network of equipments that are enclosed by the selected managed object in the Network Module; or the equipment
details of the selected managed object in the Inventory Module.
Show Details - Available when clicking managed objects that have additional details that can be displayed.
It either shows the network of equipments that are enclosed by the selected managed object in the Network Module; or the equipment
details of the selected managed object in the Inventory Module. -
 Show Services - Available when clicking managed objects that have services associated with them that can be displayed.
It shows the services that the selected equipment is part of in the Service Module.
Show Services - Available when clicking managed objects that have services associated with them that can be displayed.
It shows the services that the selected equipment is part of in the Service Module. -
 Show Enclosing Network - Available whenever the currently displayed network is contained in another network.
Typically this option is available after a Show Details action.
Show Enclosing Network - Available whenever the currently displayed network is contained in another network.
Typically this option is available after a Show Details action. -
 Alarms - Available when clicking managed objects that have alarms raised on them.
This menu option provides you with two more options:
Alarms - Available when clicking managed objects that have alarms raised on them.
This menu option provides you with two more options:
-
 Acknowledge - Available when there are unacknowledged alarms on the selected managed object. Acknowledges the selected alarm
of the specified severity from the severity menu displayed.
Acknowledge - Available when there are unacknowledged alarms on the selected managed object. Acknowledges the selected alarm
of the specified severity from the severity menu displayed. -
 UnAcknowledge - Available when there are acknowledged alarms on the selected managed object. Cancels the acknowledgement of
the selected alarm of the specified severity from the severity menu displayed.
UnAcknowledge - Available when there are acknowledged alarms on the selected managed object. Cancels the acknowledgement of
the selected alarm of the specified severity from the severity menu displayed.
-
-
-
Service Module:
-
Show Details - Available when clicking a service. It shows the service-centric view of the network of equipments that are
associated with the service in a separate detail view window.
-
-
All Modules:
-
View Controls Area
-
Tree Resource View
-
All Modules:
- Click the expand/collapse icons to expand or collapse objects to show or hide objects at a lower level.
- Click the object itself to select it in the Tree View and the Main View.
-
Service Module:
- Click the object as well as selecting it in the Tree View and the Main View: the associated services are highlighted in the Main View when you click an SLA or a Customer.
-
All Modules:
-
Table Resource View
-
All Modules:
- Click the the different tabs to switch between the alarms table and the managed objects table.
- In any of the managed object tables you can click managed object name to select the managed object in the Main and Tree Views.
- Choose different filters from the pulldown menu to show only the managed object of a given type that is of interest to you. In the alarms table, the filters will only show the alarms whose target managed object is of the selected type.
- Use the built-in table controls to show all objects in the table at once, or to display the next or the previous set of objects.
- Sort the table by a given piece of information by clicking in a column header.
-
Service Module:
- Clicking an SLA or a Customer additionally causes the associated services to be highlighted in the Main View.
-
All Modules:
Installing the Thin-Client Sample
The sample contains a WAR file (Web Archive) that allows you to easily install the sample on any server that supports the Servlet API 2.1 or later. For your convenience, the WAR will be copied to the Tomcat web server that is supplied with the Perforce JViews installation when you start the server using the supplied scripts. Tomcat is the official reference implementation of the Servlet and JSP specifications. If you are already using an up-to-date Web or application server, there is a good chance that it already has everything you need. The sample can also be deployed to WebSphere Application Server (WAS).
Running the Sample Using Tomcat
If you intend to use the Tomcat Web server provided with this
installation, follow these instructions to start the server:
Running the Server-Side Samples.
The scripts to start the server can be found in the
tools/tomcat-jsf directory.
Note: if you are running on Windows then you will find menu items in
the Windows "start" menu to start and stop the Tomcat server.
Once the server is running, you can see the sample by opening the following page:
- Perforce JViews TGO Sample: JSF Integration - Monitoring
http://localhost:8080/jsf-integration-monitoring
Running the Sample Using WebSphere Application Server
In addition to the instructions provided for using Tomcat, the samples can be
viewed on WebSphere Application Server. Follow the instructions:
Running the Server-Side Samples
and use the scripts to start the server and deploy the sample.
Once the server is running, you can see the sample
by opening the following page:
http://localhost:9443/jsf-integration-monitoring
The WAS administrative console can be used to verify or modify server settings:
http://localhost:9043/ibm/console/
Note: the WAS server can start on a range of port numbers, therefore the value
is not guaranteed to remain the same.
The scripts provided with the samples can be used to obtain the port numbers used
by the Admin Console and by the deployed Web applications.
To retrieve a list of all the WAS port numbers, run the command line instruction:
ant -f build_was.xml ws.list.ports
Topics Covered
- From a business point of view, this sample shows how to implement the following use cases:
- Represent networks in geo-positioned representations.
- Represent network equipment details.
- Represent services associated with network equipment.
- Inspect the topology of networks and their equipments.
- Monitor the state of network equipments.
- Manage the alarm state of network equipments.
- Discover services associated with network equipments.
- Inspect service-centric representations of networks.
- From a developer point of view, this sample illustrates how to approach the following topics:
- Integrating JViews TGO with MyFaces components (such as table, tree, poll, layout, and frames).
- Integrating JViews TGO with an arbitrary alarm notification system.
Detailed Description
The sample contains two main areas:
-
The Application Controls Area
This area has the controls that drive the entire application. In this area you can control:-
 Page Refresh
-
Page Refresh Rate
Indicates whether or not the page will refresh itself and if so how often. -
 Refresh Page
Requests a page refresh; this is the recommended way to refresh the page (as opposed to F5 or CTRL+R).
-
Page Refresh Rate
-
Alarm Generation
-
Alarm Generation Rate
Indicates whether or not alarms are to be automatically generated and if so how often. -
 Remove All
Requests that all alarms generated be removed (deleted), typically to start fresh.
-
Alarm Generation Rate
-
-
The Application Area
This area has the controls that provide the main business use cases of the sample. This area is composed of three main modules:-
Network Module
This module provides Network Management functionality and represents the network in a geo-positioned manner. -
Inventory Module
This module provides Inventory Management functionality and displays the details of network equipment at a fine level. -
Service Module
This module provides Service Management functionality and represents the different service-related business entities graphically to aid in service-to-equipment correlation.
Each one of the modules has the following main areas:
-
-
Main Resource View
Shows the network resources such as equipment, links and services, as well as any alarms that have been raised on them, in a geographical or topological representation depending on the target data model. The top part of the Main Resource View contains additional controls that allow users to inspect the contents of the Main View in different ways. -
Tree Resource View
Shows the network resources such as equipment, links and services in a hierarchical representation. -
Table Resource View
Shows the network resources such as equipment, links and services, as well as any alarms that have been raised on them, in a tabular representation that allows for quick sorting and inspection of larger amounts of network resources.
This diagram describes the major parts of the web client design. The web client refers to the
monitoring.web.SampleContext
which serves as the hub for all resources that are needed and available for the sample. The
monitoring.web.SampleContext provides access to three major types:
-
monitoring.web.SampleActionProviders
This type hosts all the abstractions responsible for providing the actions to be executed in the sample given a user interaction. It supplies the specialized action providers for the sample's main components, namely the network, equipment, table and tree components. It also provides an abstraction that holds the actions that are common, or shared, across the sample. -
monitoring.web.SampleControls
This type hosts all the abstractions responsible for hosting the UI controls that are used to build the web interface. It provides the types that hold the controls specific to a specific main area of the sample's UI, namely the network, equipment, table and tree components. It also provides an abstraction that holds the controls that are shared across the sample's UI. -
monitoring.web.SampleDataStructures
This type hosts the abstractions responsible for providing the data structures that are used by the sample:-
monitoring.web.SampleDataModels
Provides data models that are used to integrate the JViews TGO data model (data sources) with the MyFaces tree and table components, by providing accessors to the models used in the tree and table components for all three modules. -
monitoring.web.SampleDataSources
Provides the data sources used by the JViews TGO faces components, namely the Network Module network, the Inventory Module equipment, the Service Module network, the network displayed in the service details view of the Service Module, the data source for which information is displayed in the tree view of the Service Module, which is different from the Service Module network, and the data source that contains the alarms in the sample.
-
This diagram shows the main types used to integrate a backend alarm monitoring system in this sample. In the case of this sample, the alarm monitoring system is a simulated system that is activated, deactivated and called through the use of an alarm generator that is available through the web client UI.
The
monitoring.web.SampleContext
contains references to the two main types in this integration/alarm monitoring simulation scheme:
-
monitoring.web.oss.IntegrationProvider
This type serves as the entry point to all the sample's functionality that affects (or is affected by) the alarm monitoring system in some way. It provides a simplistic approach to encapsulating the intricacies of the alarm monitoring integration as it is a bean that needs only a few basic properties to be set before it is functional. This type provides access to two main abstractions that have key roles in the alarm monitoring integration scheme:-
integration.AlarmProvider
This type serves as the main source of alarm-related services. It manages the alarms generated in this sample and provides efficient access to these. It allows users to specify different criteria for obtaining only the alarms of interest. -
integration.DataSourceProvider
This type serves as the ultimate and unified source of the data sources that are used in the sample. Themonitoring.web.SampleContextgets the data source provided by this entity and populates itsmonitoring.web.SampleDataSourceswhich is then used by the entire web application.
monitoring.web.oss.IntegrationProviderhas references to two other important types:- An
integration.IntegrationDispatcherwhich is a type used to dispatch generic requests to any alarm monitoring system. It is used by themonitoring.web.oss.IntegrationProviderto delegate the various requests that it receives. - An
integration.RequestHandlerwhich is used to handle the various types of request. This entity handles the requests using the model abstractions provided by JViews TGO. It is installed in theintegration.IntegrationDispatcherso that different implementations can be swapped in and out easily.
-
-
monitoring.generator.AlarmGenerator
This type uses standard random generation techniques to create alarms on the managed objects contained in the Network Module network data source. The alarms generated are based on the JViews TGO model abstractions and are used to populate the alarms data source.
Installation Directory
The JSF Integration - Monitoring sample is installed here.
Classes Involved
- ilog.tgo.faces.network.dhtml.component.IltFacesDHTMLNetworkView
- ilog.tgo.faces.equipment.dhtml.component.IltFacesDHTMLEquipmentView
- ilog.views.faces.dhtml.component.IlvFacesDHTMLOverview
- ilog.views.faces.dhtml.IlvDHTMLConstants
- ilog.views.faces.dhtml.event.FacesViewActionEvent
- ilog.views.faces.dhtml.event.FacesViewActionListener
- ilog.views.faces.dhtml.event.FacesMenuActionEvent
- ilog.views.faces.dhtml.event.FacesMethodBindingActionListener
- ilog.views.util.servlet.IlvMenuFactory
- ilog.views.util.servlet.model.IlvMenu
- ilog.views.util.servlet.model.IlvMenuItem
- ilog.views.util.servlet.model.IlvMenuSeparator
- ilog.views.util.servlet.event.JavaScriptActionListener
- ilog.views.util.servlet.IlvPopupMenuServletSupport
- ilog.tgo.model.IltAlarm
- ilog.tgo.model.IltCard
- ilog.tgo.model.IltCardItem
- ilog.tgo.model.IltCardCarrier
- ilog.tgo.model.IltShelf
- ilog.tgo.model.IltShelfItem
- ilog.tgo.model.IltEmptySlot
- ilog.tgo.model.IltGroup
- ilog.tgo.model.IltLed
- ilog.tgo.model.IltLinearGroup
- ilog.tgo.model.IltLink
- ilog.tgo.model.IltNetworkElement
- ilog.tgo.model.IltObject
- ilog.tgo.model.IltOffPageConnector
- ilog.tgo.model.IltPolyGroup
- ilog.tgo.model.IltPort
- ilog.tgo.model.IltRectGroup
- ilog.tgo.model.IltAlarmSeverity
- ilog.tgo.model.IltObjectState
- ilog.cpl.service.IlpContext
- ilog.tgo.faces.service.IltFacesDefaultContext
- ilog.cpl.datasource.IlpDataSource
- ilog.cpl.datasource.IlpMutableDataSource
- ilog.cpl.datasource.IlpDefaultDataSource
- ilog.tgo.datasource.IltDefaultDataSource
- ilog.cpl.datasource.IlpAbstractHierarchyAdapter
- ilog.cpl.datasource.DataSourceEvent
- ilog.cpl.datasource.DataSourceListener
- ilog.cpl.datasource.DataSourceObjectEvent
- ilog.cpl.datasource.structure.IlpContainer
- ilog.cpl.datasource.structure.IlpChild
- ilog.cpl.util.IlpFilter
- ilog.cpl.util.IlpI18NUtil
- ilog.cpl.graphic.IlpGraphicComponent
- ilog.cpl.equipment.EquipmentSelectionEvent
- ilog.cpl.equipment.EquipmentSelectionListener
- ilog.cpl.network.NetworkSelectionEvent
- ilog.cpl.network.NetworkSelectionListener
- ilog.cpl.graph.IlpGraphSelectionModel
- ilog.cpl.util.selection.IlpObjectSelectionModel
- ilog.cpl.model.IlpAttribute
- ilog.cpl.model.IlpAttributeValueHolderSupport
- ilog.cpl.model.IlpRepresentationObject
- ilog.cpl.model.IlpClass
- ilog.cpl.model.IlpClassManager
Source Files
- monitoring.web.AbstractSampleContext
- monitoring.web.SampleContext
- monitoring.web.SampleConstants
- monitoring.web.SampleActionProviders
- monitoring.web.SampleControls
- monitoring.web.SampleDataStructures
- monitoring.web.SampleDataModels
- monitoring.web.SampleDataSources
- monitoring.web.action.BaseActionProvider
- monitoring.web.action.SharedActionProvider
- monitoring.web.action.NetworkActionProvider
- monitoring.web.action.EquipmentActionProvider
- monitoring.web.action.TableActionProvider
- monitoring.web.action.TreeActionProvider
- monitoring.web.controls.SharedControls
- monitoring.web.controls.NetworkControls
- monitoring.web.controls.EquipmentControls
- monitoring.web.controls.TableControls
- monitoring.web.controls.TreeControls
- monitoring.web.controls.configurator.AbstractComponentConfigurator
- monitoring.web.controls.configurator.NetworkConfigurator
- monitoring.web.controls.configurator.EquipmentConfigurator
- monitoring.web.controls.popup.AbstractContextualMenuFactory
- monitoring.web.controls.popup.NetworkContextualMenuFactory
- monitoring.web.controls.popup.InventoryContextualMenuFactory
- monitoring.web.controls.popup.ServiceContextualMenuFactory
- monitoring.web.controls.popup.AlarmStateActionListener
- monitoring.web.controls.popup.ServerClientActionListener
- monitoring.web.drilldown.EquipmentDrillDownManager
- monitoring.web.model.integration.IntegratedDataModelProvider
- monitoring.web.model.integration.AbstractIntegratedDataModelProvider
- monitoring.web.model.integration.IntegratedTableDataModelProvider
- monitoring.web.model.integration.IntegratedTreeDataModelProvider
- monitoring.web.model.integration.beans.TGOObject
- monitoring.web.model.integration.beans.TGOObjectHierarchical
- monitoring.web.model.integration.filters.TypeFilter
- monitoring.web.model.integration.filters.OriginFilter
- monitoring.web.model.integration.filters.HideTypeFilter
- monitoring.web.model.integration.filters.AlarmOnTypeFilter
- monitoring.web.oss.AbstractIntegrationProvider
- monitoring.web.oss.IntegrationProvider
- monitoring.web.utils.WebUtils
- monitoring.web.utils.ObjectStylingUtils
- monitoring.web.utils.ServiceStylingUtils
- monitoring.web.utils.AlarmStylingUtils
- monitoring.shared.drilldown.AbstractDrillDownManager
- monitoring.shared.drilldown.NetworkDrillDownManager
- monitoring.shared.drilldown.EquipmentDrillDownManager
- monitoring.shared.MonitoringConstants
- monitoring.shared.ServicesUtils
- monitoring.generator.AbstractAlarmGenerator
- monitoring.generator.AlarmGenerator
- integration.AlarmProvider
- integration.IntegrationDispatcher
- integration.RequestHandler
- integration.impl.IntegrationRequestHandler
- integration.IntegrationRequest
- integration.DataSourceProvider