Perforce JViews Charts Sample: Memory Monitor
Description
 |
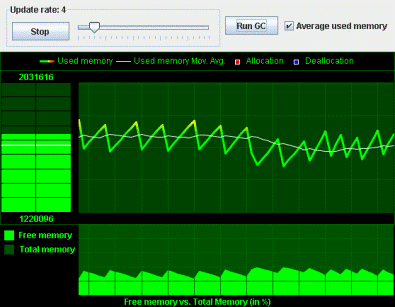
This sample displays the memory usage of the current JVM (the one executing the sample) over time. The information shown in the sample is:
- The instant memory used (as a gradient bar chart).
- The memory used (as a gradient polyline) compared to the moving average of the memory used (as a white polyline) over time.
- The free memory compared to the total memory over time.
How to Use the Sample
- Press Animate to launch the simulation.
- Move the slider to adjust the number of updates per second.
- Press Run GC to run the VM Garbage Collector.
- Show/Hide the average memory usage using the corresponding radio button.
How to Run the Sample as an Application
This sample can
be run as an application.
The installation directory contains
an executable JAR file,
monitor.jar,
that allows you to execute the sample with a double click from a
file browser. Note that if you are using Internet Explorer, you can
open the installation directory
and execute the JAR file from the browser. This
technique may not work in other Web browsers.
Alternatively, you
can run the sample application from the command line.
First check that the Ant utility is properly configured. If not, see the
instructions on how to configure Ant for Perforce JViews.
Then, go to the installation directory
of the sample and type:
ant run
Topics Covered
- Synchronization of the axis of two different charts.
- Creating a custom grid that draws a fixed number of grid lines.
- Adding annotations and decorations to a chart.
- Handling the dynamic update of data sets using listeners.
Detailed Description
This sample shows how to synchronize the axis of two different charts. The sample monitors the memory usage of the current JVM (the one executing the sample) over time and displays it in three charts:
- In the top-left chart, the instant memory used compared to the average memory used during the last 15 measures. The memory used is stored in a data set and rendered by a bar chart renderer with a value gradient whose colors are defined from green (low memory used) to red (no more free memory available). The average memory used is rendered by a data indicator whose value is modified each time a point is added to the memory used data set.
- In the center chart, the detailed memory usage history: the memory used (a gradient polyline renderer) and the average memory used during the last 15 measurements (the white polyline renderer). When a new measurement is done, if the total memory has changed, an annotation is added to the chart describing this change: a red square if the total memory increased (allocation), and a blue square if the total memory decreased (deallocation).
- In the bottom chart, the history of the amount of free memory compared to the total memory, rendered using a stacked 100 area renderer.
As written previously, the axis of the charts are synchronized to easily handle updates of the axis visible range. Indeed, since the total memory might change (for the instant memory usage chart and the history chart) or due to the automatic scroll (for the history chart and the history area chart), every chart sharing the same data (the total amount of memory or the time scale, respectively) needs to handle these updates in the same way:
- The Y-axis of the center chart is synchronized with the Y-axis of the top-left chart. This synchronization allows their plotting rectangles and their grids to be perfectly aligned when the total memory changes (leading to a new visible range along the Y-axis).
- The X-axis of the bottom chart is synchronized with the X-axis of the center chart. This synchronization allows the grids of the charts to be perfectly aligned when a new measurement is added to the charts and a scroll occurs (leading to a new visible range along the X-axis).
Installation Directory
The Memory Monitor sample is installed here.
Classes Involved
- ilog.views.chart.IlvChart
- ilog.views.chart.renderer.IlvBarChartRenderer
- ilog.views.chart.renderer.IlvPolylineChartRenderer
- ilog.views.chart.renderer.IlvAreaChartRenderer
- ilog.views.chart.data.IlvDefaultDataSet
- ilog.views.chart.data.IlvMovingAvgDataSet
- ilog.views.chart.graphic.IlvDataIndicator
- ilog.views.chart.graphic.IlvMarkerIcon
- ilog.views.chart.java2d.IlvValueGradientPaint
- ilog.views.chart.event.DataSetListener
Source Files
- monitor.MemoryMonitor
- monitor.MemoryListener
- monitor.HistoryPanel
- monitor.HistoryAreaPanel
- monitor.FixedGrid