- java.lang.Object
-
- ilog.views.chart.IlvChartOwnedDrawable
-
- ilog.views.chart.IlvChartDecoration
-
- ilog.views.chart.graphic.IlvDataIndicator
-
- All Implemented Interfaces:
- IlvChart3DSupport, IlvChartDrawable, Serializable
- Direct Known Subclasses:
- IlvThresholdIndicator
public class IlvDataIndicator
extends IlvChartDecoration
Represents a graphical indicator of data values.An
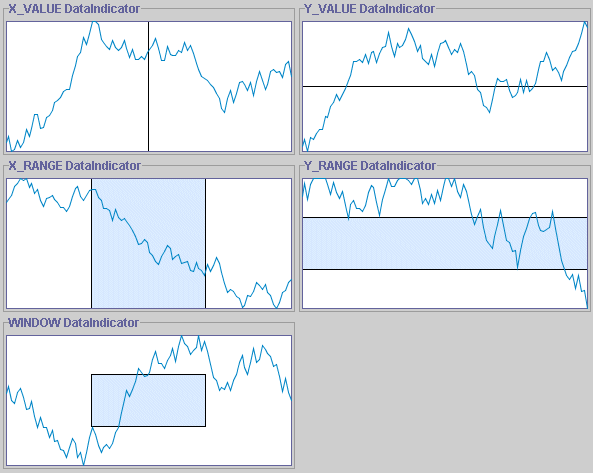
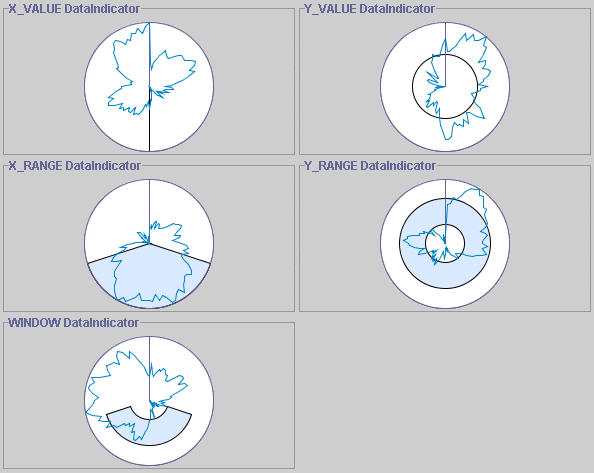
IlvDataIndicatorcan be used to represent different types of data values, each one with its own graphical representation. Here is the possible type of values that can be marked :- A value along the x-axis.
- A value along the y-axis.
- A data range along the x-axis.
- A data range along the y-axis.
- A data window.
And here are two pictures showing the graphical representations associated with the different types of data values, for a Cartesian chart and a radar chart:


- Since:
- JViews 5.0
- See Also:
IlvChart.addDecoration(ilog.views.chart.IlvChartDecoration), Serialized Form
-
-
Field Summary
Fields Modifier and Type Field and Description static intWINDOWType constant: specifies that the indicator is used to mark a data window.static intX_RANGEType constant: specifies that the indicator is used to mark a data range along an x-axis.static intX_VALUEType constant: specifies that the indicator is used to mark a value along an x-axis.static intY_RANGEType constant: specifies that the indicator is used to mark a data range along a y-axis.static intY_VALUEType constant: specifies that the indicator is used to mark a value along a y-axis.
-
Constructor Summary
Constructors Constructor and Description IlvDataIndicator(int axisIndex, double value, String text)Creates an indicator for the specified value with the specified text.IlvDataIndicator(int axisIndex, IlvDataInterval range, String text)Creates an indicator for the specified range with the specified text.IlvDataIndicator(int yAxisIndex, IlvDataWindow dataWindow, String text)Creates an indicator for the specified data window with the specified text.
-
Method Summary
All Methods Instance Methods Concrete Methods Modifier and Type Method and Description voidafterDraw(Graphics g)Draws the border of the indicator into the specifiedGraphicscontext.protected voidbaseTextDirectionChanged()This method is invoked when the effective base text direction of the chart has changed.voidbeforeDraw(Graphics g)Draws the background of the indicator into the specifiedGraphicscontext.protected voidchartConnected(IlvChart oldChart, IlvChart newChart)Called when the indicator is added to or removed from a chart.protected voidcomponentOrientationChanged(ComponentOrientation oldOrientation, ComponentOrientation newOrientation)This method is invoked when the component orientation of the chart has changed.protected IlvDoublePointcomputeLabelLocation(IlvDataWindow dataWindow)Returns the location of the label.booleancontains(int x, int y)Indicates whether the graphical representation of the indicator contains the specified point.voiddraw(Graphics g)Draws the indicator into the specifiedGraphicscontext.intgetAxisIndex()Returns the index of the axis to which this indicator is attached.Rectangle2DgetBounds(Rectangle2D retBounds)Returns the bounds of this decoration.IlvDataWindowgetDataWindow()Returns the data window displayed by the indicator.IlvStylegetDrawStyle()Returns the rendering style actually used for this indicator.IlvLabelRenderergetLabelRenderer()Returns the renderer of the text displayed by this indicator.IlvDataIntervalgetRange()Returns the range displayed by this indicator.ShapegetShape()Returns theShapecorresponding to this data indicator.IlvStylegetStyle()Returns the rendering style of this indicator.StringgetText()Returns the text associated with this indicator.intgetType()Returns the type of this indicator.doublegetValue()Sets the value displayed by the indicator.booleanhas3DSupport()Indicates whether the indicator supports three-dimensional drawing.voidsetDataWindow(double xMin, double xMax, double yMin, double yMax)Modifies the data window displayed by this indicator.voidsetDataWindow(IlvDataWindow w)Modifies the data window displayed by this indicator.voidsetLabelRenderer(IlvLabelRenderer renderer)Sets the renderer of the text displayed by this indicator.voidsetRange(IlvDataInterval range)Sets the range displayed by this indicator.voidsetStyle(IlvStyle style)Specifies the rendering style of this indicator.voidsetText(String text)Sets the text associated with this indicator.voidsetValue(double value)Sets the value displayed by the indicator.voidsetVisible(boolean visible)Toggles the visibility of this decoration.protected voidupdateBoundsCache()Updates the bounds cache of this decoration.-
Methods inherited from class ilog.views.chart.IlvChartDecoration
getChart, getDrawOrder, isVisible, repaint, setDrawOrder
-
-
-
-
Field Detail
-
X_VALUE
public static final int X_VALUE
Type constant: specifies that the indicator is used to mark a value along an x-axis.- See Also:
getType(), Constant Field Values
-
Y_VALUE
public static final int Y_VALUE
Type constant: specifies that the indicator is used to mark a value along a y-axis.- See Also:
getType(), Constant Field Values
-
X_RANGE
public static final int X_RANGE
Type constant: specifies that the indicator is used to mark a data range along an x-axis.- See Also:
getType(), Constant Field Values
-
Y_RANGE
public static final int Y_RANGE
Type constant: specifies that the indicator is used to mark a data range along a y-axis.- See Also:
getType(), Constant Field Values
-
WINDOW
public static final int WINDOW
Type constant: specifies that the indicator is used to mark a data window.- See Also:
getType(), Constant Field Values
-
-
Constructor Detail
-
IlvDataIndicator
public IlvDataIndicator(int axisIndex,
                        double value,
                        String text)
Creates an indicator for the specified value with the specified text.- Parameters:
axisIndex- The index of the considered axis:-1for the x-axis, or the index of a given y-axis. The type of this indicator is set toX_VALUEorY_VALUEaccordingly.value- The considered value.text- The text to display. May benullif no text is drawn.- See Also:
getType()
-
IlvDataIndicator
public IlvDataIndicator(int axisIndex,
                        IlvDataInterval range,
                        String text)
Creates an indicator for the specified range with the specified text.- Parameters:
axisIndex- The index of the considered axis:-1for the x-axis, or the index of a given y-axis. The type of this indicator is set toX_RANGEorY_RANGEaccordingly.range- The considered range.text- The text to display. May benullif no text is drawn.- See Also:
getType()
-
IlvDataIndicator
public IlvDataIndicator(int yAxisIndex,
                        IlvDataWindow dataWindow,
                        String text)
Creates an indicator for the specified data window with the specified text. The type of this indicator is set toWINDOW.- Parameters:
yAxisIndex- The index of the considered y-axis.dataWindow- The considered data window.text- The text to display. May benullif no text is drawn.- See Also:
getType()
-
-
Method Detail
-
chartConnected
protected void chartConnected(IlvChart oldChart,
                              IlvChart newChart)
Called when the indicator is added to or removed from a chart.- Overrides:
chartConnectedin classIlvChartDecoration- Parameters:
oldChart- The chart with which the decoration was associated, ornullif the decoration is added to a new chart.newChart- The chart to which the decoration is added, ornullif the decoration is removed from its current chart.- Throws:
IndexOutOfBoundsException- If the index of the y-axis is not valid.- Since:
- JViews 5.5
- See Also:
IlvChartOwnedDrawable.getChart()
-
has3DSupport
public boolean has3DSupport()
Indicates whether the indicator supports three-dimensional drawing.- Specified by:
has3DSupportin interfaceIlvChart3DSupport- Specified by:
has3DSupportin interfaceIlvChartDrawable- Overrides:
has3DSupportin classIlvChartDecoration- Returns:
trueif the indicator is drawn by a Cartesian chart, andfalseotherwise.- Since:
- JViews 5.5
-
getAxisIndex
public final int getAxisIndex()
Returns the index of the axis to which this indicator is attached.
-
getType
public final int getType()
Returns the type of this indicator.
-
getValue
public final double getValue()
Sets the value displayed by the indicator. The returned value is only relevant if the type of the indicator isX_VALUEorY_VALUE.
-
setValue
public void setValue(double value)
Sets the value displayed by the indicator. This method can only be used if the type of the indicator isX_VALUEorY_VALUE.- Throws:
UnsupportedOperationException- The type of the indicator is different fromX_VALUEorY_VALUE.
-
getRange
public final IlvDataInterval getRange()
Returns the range displayed by this indicator.- Returns:
- The range displayed by this indicator, or
nullif the type of the indicator is different fromX_RANGEorY_RANGE. - See Also:
setRange(ilog.views.chart.IlvDataInterval)
-
setRange
public void setRange(IlvDataInterval range)
Sets the range displayed by this indicator. This method can only be used if the type of the indicator isX_RANGEorY_RANGE.- Throws:
UnsupportedOperationException- The type of the indicator is different fromX_RANGEorY_RANGE.
-
getDataWindow
public final IlvDataWindow getDataWindow()
Returns the data window displayed by the indicator. The returned window is only relevant if the type of the indicator isX_RANGE,Y_RANGE, orWINDOW.
-
setDataWindow
public void setDataWindow(IlvDataWindow w)
Modifies the data window displayed by this indicator. This method can only be used if the type of the indicator isWINDOW.- Throws:
UnsupportedOperationException- The type of the indicator is notWINDOW.
-
setDataWindow
public void setDataWindow(double xMin,
                          double xMax,
                          double yMin,
                          double yMax)
Modifies the data window displayed by this indicator. This method can only be used if the type of the indicator isWINDOW.- Throws:
UnsupportedOperationException- The type of the indicator is notWINDOW.- Since:
- JViews 5.5
-
getText
public String getText()
Returns the text associated with this indicator. May returnnullif no text is drawn.
-
setText
public void setText(String text)
Sets the text associated with this indicator. Depending on the indicator type, the text is rendered using the fill color of the drawing style for theX_VALUEorY_VALUEtypes, or with the stroke color of the drawing style in the other cases.- Parameters:
text- The text to draw. May benull.- See Also:
getType(),setStyle(ilog.views.chart.IlvStyle)
-
getLabelRenderer
public final IlvLabelRenderer getLabelRenderer()
Returns the renderer of the text displayed by this indicator.
-
setLabelRenderer
public void setLabelRenderer(IlvLabelRenderer renderer)
Sets the renderer of the text displayed by this indicator.- Since:
- JViews 6.0
-
getStyle
public final IlvStyle getStyle()
Returns the rendering style of this indicator.
-
setStyle
public void setStyle(IlvStyle style)
Specifies the rendering style of this indicator.
-
getDrawStyle
public IlvStyle getDrawStyle()
Returns the rendering style actually used for this indicator. The default implementation of this method usesgetStyle()when it has a non-nullvalue, and a style that depends on the chart otherwise.- Since:
- JViews 8.1
- See Also:
getStyle()
-
beforeDraw
public void beforeDraw(Graphics g)
Draws the background of the indicator into the specifiedGraphicscontext.- Overrides:
beforeDrawin classIlvChartDecoration- Since:
- JViews 8.1
-
draw
public void draw(Graphics g)
Draws the indicator into the specifiedGraphicscontext.Note: This method draws nothing. The actual drawing is produced by the
beforeDraw(java.awt.Graphics)andafterDraw(java.awt.Graphics)methods.- Specified by:
drawin interfaceIlvChartDrawable- Specified by:
drawin classIlvChartDecoration
-
afterDraw
public void afterDraw(Graphics g)
Draws the border of the indicator into the specifiedGraphicscontext.- Overrides:
afterDrawin classIlvChartDecoration- Since:
- JViews 8.1
-
computeLabelLocation
protected IlvDoublePoint computeLabelLocation(IlvDataWindow dataWindow)
Returns the location of the label. The default implementation centers the label both vertically and/or horizontally, depending on the data indicator type.- Parameters:
dataWindow- The data window covered by this indicator. This parameter is the visible window forX_VALUEandY_VALUEdata indicators.- Returns:
- The location of the label in the screen coordinates. The returned point is the center of the label.
-
getBounds
public Rectangle2D getBounds(Rectangle2D retBounds)
Returns the bounds of this decoration.- Specified by:
getBoundsin interfaceIlvChartDrawable- Overrides:
getBoundsin classIlvChartDecoration- Parameters:
retBounds- A rectangle optionally used to store the result. If this parameter isnull, a newRectangle2Dis allocated.- Returns:
- The bounds of this decoration.
-
getShape
public Shape getShape()
Returns theShapecorresponding to this data indicator.- Since:
- JViews 6.0
-
contains
public boolean contains(int x,
                        int y)
Indicates whether the graphical representation of the indicator contains the specified point.- Parameters:
x- The x-coordinate of the considered point, expressed in the projected space.y- The y-coordinate of the considered point, expressed in projected space.- Returns:
trueif the point lies within the graphical representation of the indicator,falseotherwise.
-
updateBoundsCache
protected void updateBoundsCache()
Updates the bounds cache of this decoration. This needs to be called whenever the bounds of this decoration change whilegetChart() && isVisible()is true, or whengetChart() && isVisible()becomes true.- Overrides:
updateBoundsCachein classIlvChartDecoration
-
componentOrientationChanged
protected void componentOrientationChanged(ComponentOrientation oldOrientation,
                                           ComponentOrientation newOrientation)
This method is invoked when the component orientation of the chart has changed.- Overrides:
componentOrientationChangedin classIlvChartDecoration- Parameters:
oldOrientation- The component orientation before the change.newOrientation- The component orientation after the change.- See Also:
Component.getComponentOrientation()
-
baseTextDirectionChanged
protected void baseTextDirectionChanged()
This method is invoked when the effective base text direction of the chart has changed. That is, it is invoked- when the value of
chart.getResolvedBaseTextDirection()has changed, or - when the value of
chart.getComponentOrientation()has changed and the value ofchart.getResolvedBaseTextDirection()isIlvBidiUtil.CONTEXTUAL_DIRECTION.
- Overrides:
baseTextDirectionChangedin classIlvChartDecoration- See Also:
IlvChart.getResolvedBaseTextDirection(),Component.getComponentOrientation()
- when the value of
-
setVisible
public void setVisible(boolean visible)
Toggles the visibility of this decoration.- Overrides:
setVisiblein classIlvChartDecoration- See Also:
IlvChartDecoration.isVisible()
-
-