Look and feel
JViews TGO is able to turn business data into specialized graphical representations. High-level views, such as tree, topology, chassis or table views, are automatically populated with graphic objects whose icons, decorations and annotations are driven by business-specific logic. However, the appropriate representation can differ a lot, depending on the context and purpose of the display. One can distinguish two main domains: Network Management and Network Visualization. JViews TGO offers both ready-to-use and highly configurable solutions to translate information into pictures.
Default look and feel
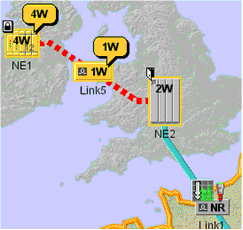
The default look and feel, which comes natively with JViews TGO, is intended to be used by professional network managers. It includes extremely precise ways to display interconnected assets (such as nodes, networks and equipments), and management information (such as alarms and states). The underlying look and feel is based on international and industrial standards, as well as the long-term expertise of Rogue Wave® in this domain. For example, a single node usually aggregates a lot of information such as its name, type, function, family, operational state, different kinds of alarms, primary and secondary states, and so on. Based on various preferences and settings specified by the programmer, JViews TGO is able to automatically build an appropriate visual representation. The aim is to display as much relevant information as possible while, at the same time, reducing the risk of mistakes. Here is a typical example of the default look and feel:
This look and feel is often too precise for pure network visualization needs. For this reason, JViews TGO offers other flexible ways to represent business information.
Custom look and feel
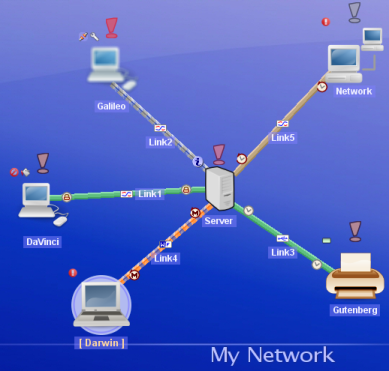
For domains where the graphical representation should be less constrained and possibly more attractive, JViews TGO offers different ways to enrich the default look and feel. For example, it is very easy to define new icons for some kinds of node or state, or to define a specific representation for a given router when it does not work properly. In contrast with demanding network management activities, this is particularly suitable for network and asset visualization for which there is less precise information to display but in a more attractive way. This type of configuration can be performed through Java™ code using the open API of JViews TGO, or through configuration files based on the Cascading Style Sheets (CSS) syntax. So it is possible to describe the mapping between information and its desired visual representation, and allow developers to reuse and share the newly-defined look and feel between many different applications. Here is a typical example of a custom look and feel:
For a working example, run the Customizing Business Objects Sample located in
<installdir> /samples/integration/customization.
Copyright © 2018, Rogue Wave Software, Inc. All Rights Reserved.

