Vertical load-on-demand
Explains the mechanism for loading data into memory as it is needed.

Explains the difference between horizontal and vertical load-on-demand.
Describes how to run the sample.
Explains the classes and methods used to visualize a read-only relational database containing scheduling data.
Overview
JViews Gantt provides a mechanism for loading data into memory as it is needed for display. This mechanism is called
load-on-demand and is very valuable when visualizing large scheduling data sets. The
JViews Gantt load-on-demand mechanism consists of two separate parts. The first is called “vertical load-on-demand” and can be used to defer loading of row data in both the Gantt and Schedule charts. The second is called “horizontal load-on-demand” and is available only in the resource-oriented Schedule chart. It allows you to defer loading of reservation data based upon the current visible time interval being displayed.
Vertical load-on-demand refers to the ability to defer loading of row-oriented information until it is needed for display. Row-oriented information is activity data for a Gantt chart and resource data for a Schedule chart. Vertical load-on-demand is facilitated by the design of
JViews Gantt and also requires appropriate design of the
IlvGanttModel Implementation. The default in-memory data model implementation,
IlvDefaultGanttModel, does not support load-on-demand. The Database examples are provided to illustrate the basics of how to implement a load-on-demand data model.
The classes provided in these examples can be customized for your own use, or they can serve as a source of ideas for your own implementation:
Running the Custom Activity Chart Connection example
The source code file of the Custom Activity Chart Connection example application can be found in:
To run the example:
1. Ensure that the
Ant utility is properly configured. If not, read
Starting the samples for instructions on how to configure
Ant for
JViews Gantt.
2. Go to the directory where the sample is installed and type:
ant run
Understanding the Custom Activity Chart Connection example
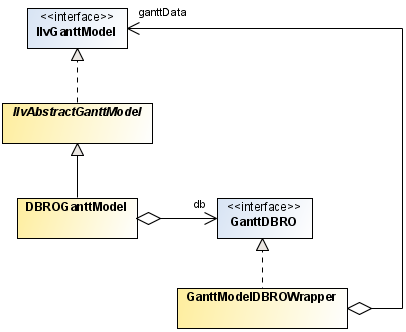
The Custom Activity Chart Connection example application visualizes a read-only relational database containing scheduling data. The Gantt chart is bound to an instance of the DBROGanttModel class. This data model implementation is designed to query a relational database defined by the GanttDBRO interface. The GanttModelDBROWrapper class implements the GanttDBRO interface by simulating a database view of an existing Gantt data model.
The following figure shows the class relationships of the Custom Activity Chart Connection example:
The DBROGanttModel data model implementation is designed to load scheduling data on-demand from an underlying relational database defined by the GanttDBRO interface. The GanttDBRO interface defines four inner interfaces that define the record structure of the activity, resource, constraint, and reservation data.
The following table show the GanttDBRO inner interfaces.
Data model entity | Database record interface |
Activities | GanttDBRO.ActivityRecord |
Resources | GanttDBRO.ResourceRecord |
Constraints | GanttDBRO.ConstraintRecord |
Reservations | GanttDBRO.ReservationRecord |
Each data model entity has a String lookup key that is unique among its instances. For activities and resources, this can be the same as the ID property, but this is not a requirement. The GanttDBRO interface defines the following database query methods:
The following table show the GanttDBRO database query methods.
Data model entity | GanttDBRO methods |
Activities | String queryRootActivityKey() |
ActivityRecord queryActivity(String key) |
String queryActivityParent(String key) |
String[] queryActivityChildren(String key) |
Resources | String queryRootResourceKey() |
ActivityRecord queryResource(String key) |
String[] queryResourceChildren(String key) |
String queryResourceParent(String key) |
Constraints | String[] queryConstraints() |
String[] queryConstraintsFromActivity(String activityKey) |
String[] queryConstraintsToActivity(String activityKey) |
ConstraintRecord queryConstraint(String key) |
Reservations | String[] queryReservations() |
String[] queryReservationsForActivity(String activityKey) |
String[] queryReservationsForResource(String resourceKey) |
String[] queryReservationsForResource(String resourceKey, Date start, Date end) |
ReservationRecord queryReservation(String key) |
The
GanttModelDBROWrapper class simulates a
GanttDBRO database by creating in-memory tables and keys from an existing Gantt data model. When you open an XML schedule data file in the Custom Activity Chart Connection, a standard
IlvDefaultGanttModel instance is created from the data. This data model is then wrappered by an instance of
GanttModelDBROWrapper that is bound to a
DBROGanttModel instance.
The following figure shows the object relationships of the Custom Activity Chart Connection example.
When an activity row is first displayed in the Gantt chart, the chart calls the method queryActivityChildren of the database. This is to determine whether the activity is a parent or a leaf row so that it can be rendered properly. The keys of the activity children are then cached in the DBROGanttModel. Then, when the activity row is expanded, the chart will call the queryActivity method of the database for each newly visible child row. This is to obtain the activity properties that are displayed. You can monitor this behavior by selecting Display Database Queries from the File menu. This will log all accesses from the DBROGanttModel to the GanttModelDBROWrapper database implementation onto the system console.
In order to achieve the same vertical load-on-demand capabilities for your application, you can create an implementation of the GanttDBRO interface that connects to the source of your scheduling data. Your scheduling data schema should be organized as four separate tables for activity, resource, constraint, and reservation records, and each table must have a primary key string that uniquely identifies each record. You can use the source code for the GanttModelDBROWrapper class to get ideas on how to design your implementation. Once you have created a GanttDBRO implementation, you can bind it to a DBROGanttModel instance and then to your chart, as follows:
IlvGanttModel dbModel = new DBROGanttModel(aGanttDBRO);
aChart.setGanttModel(dbModel);
Copyright © 2018, Rogue Wave Software, Inc. All Rights Reserved.