The Resource Data chart bean
Describes the properties of the Resource Data chart bean and shows how to incorporate a Resource Data chart into your application.

Describes the properties and architecture of the
IlvResourceDataChart class.
Explains how to incorporate a Resource Data chart into the code of your application.
Basic architecture
JViews Gantt features a high-level bean, called Resource Data chart bean. Its API is based on the
IlvResourceDataChart class, which is a subclass of
IlvScheduleDataChart. The bean encapsulates the Gantt and Charts libraries. Although the libraries can be used without the bean, you will find it easier to rely on the bean. Together with the
IlvGanttModel interface, the bean is the main class for handling Resource Data charts in the
JViews Gantt API.
The Resource Data chart displays numerical information derived from the resources in a Gantt data model. The default data displayed by the chart is the number of activities reserved by a resource at each point in time. This data is called resource loading. The Resource Data chart displays the numerical information as a standard Cartesian chart, where the x-axis represents time. In this regard, the Resource Data chart provides an alternate view of the data contained in a Gantt data model and complements the displays provided by the Gantt chart and Schedule chart beans.
The Resource Data Chart utilizes the rendering capabilities of the
IlvChart class from the Charts library. The
IlvChart class is encapsulated by
IlvResourceDataChart, which exposes a relevant subset of the complete API of
IlvChart. Therefore, you may find it useful to review Rogue Wave®
JViews Charts Developing with the
JViews Charts SDK, especially
Introducing the Main Classes, for more detailed explanations of the
JViews Charts architecture, the
IlvChartclass itself, and its related classes. This section assumes that you are familiar with the basic concepts and architecture of the
JViews Charts library.
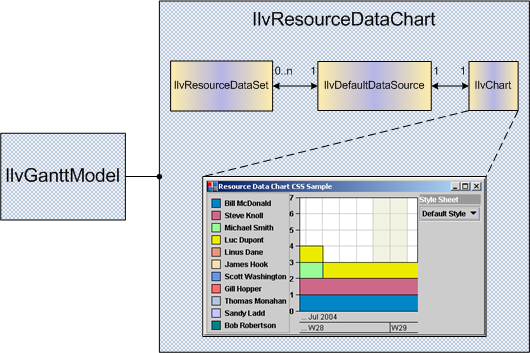
The basic architecture of the
IlvResourceDataChart bean is shown in the following figure with
IlvChart expanded out to show a graphical representation of the chart.
The following figure shows the architecture of the Resource Data chart bean.
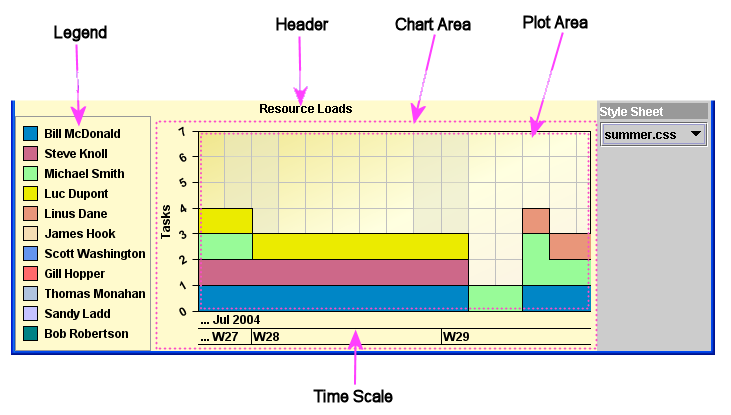
The following figure shows the chart in previous figure further expanded to show the subcomponents of the
IlvChart.
As just mentioned, the Resource Data Chart encapsulates an
IlvChart instance that provides the Cartesian chart rendering. The
IlvChart is permanently bound to a single data source that is also encapsulated and is not accessible via the
IlvResourceDataChart public API. The chart has a single chart renderer for its data source. The Resource Data Chart automatically creates an
IlvDataSet implementation for each resource in the Gantt data model that is displayed. The datasets are instances of the
IlvResourceDataSet class.
Basic steps in using the Resource Data chart bean - details
Explains what you need to do to incorporate a Resource Data chart into the code of your application.
To incorporate a Resource Data chart into your code:
1. To instantiate a Resource Data Chart and bind it to a Gantt data model, import the following packages as a minimum:
import ilog.views.gantt.*;
import ilog.views.schedule.*;
2. Create a Gantt data model that implements the
IlvGanttModel interface.
The data model should contain resources and reservations that will be displayed by the Resource Data chart. Refer to
Connecting to data for detailed information on how to instantiate different Gantt data model implementations and connect to your business data:
IlvGanttModel model = ...
3. Create the Resource Data chart bean instance with the following line of code:
IlvResourceDataChart chart = new IlvResourceDataChart();
4. Bind the Resource Data chart bean to the data model to enable the chart to display the resource and reservation information of the data model.
chart.setGanttModel(model);
5. Customize the appearance and behavior of the chart by using the API of the
IlvResourceDataChart class and its constituent components. For example, to set the time interval displayed by the x-axis to one week and add a header at the top of the chart, use the following code:
chart.setVisibleDuration(IlvDuration.ONE_WEEK);
chart.setHeaderText("My Chart");
6. Add the Resource Data chart bean to the user interface of your application in the same way as any other Swing component.
JFrame appWindow = ...
appWindow.getContentPane().add(chart, BorderLayout.CENTER);
Copyright © 2018, Rogue Wave Software, Inc. All Rights Reserved.