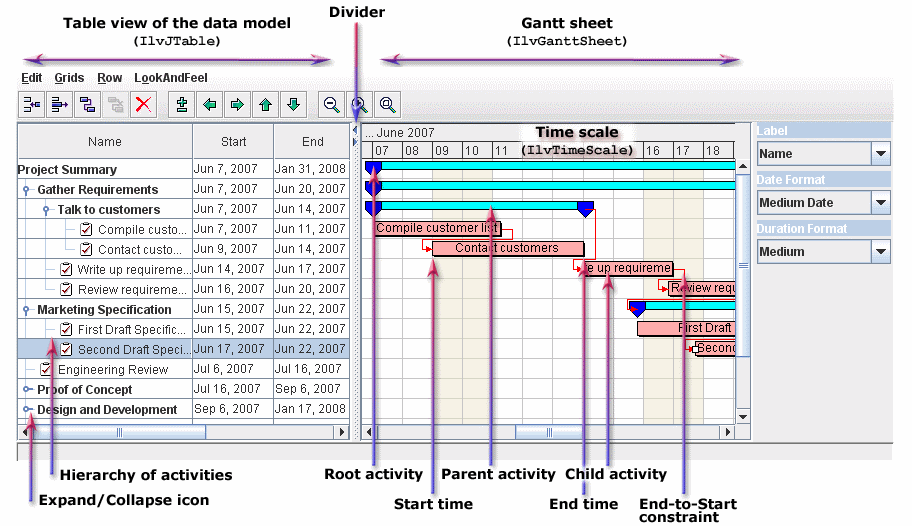
Using the Gantt sheet
This section describes how to render data in the Gantt sheet.

Explains the purpose and structure of the Gantt sheet component.
Describes how to render dates in Activity and Resource Gantt sheets.
Describes the stages you must follow to highlight a specific time in a Gantt sheet.
Describes the properties of the different layout types.
Gantt sheet architecture
The right part of a Gantt chart or Schedule chart is a graphic component called the Gantt sheet, which is an instance of the class
IlvGanttSheet. It is designed both for the graphical display of the Gantt data in a Gantt data model and as an interactive interface that allows users to manipulate the Gantt data by means of interactors implemented for this purpose.
The Gantt sheet is a user interface component designed for two main purposes:
To display the data of a given Gantt data model graphically, namely:
Activities and constraints in a Gantt chart
Reservations in a Schedule chart
To let users interact with the current instance of the
IlvGanttModel interface by means of a number of interactors developed for this purpose.
The following figure shows the Gantt sheet in a Gantt chart.
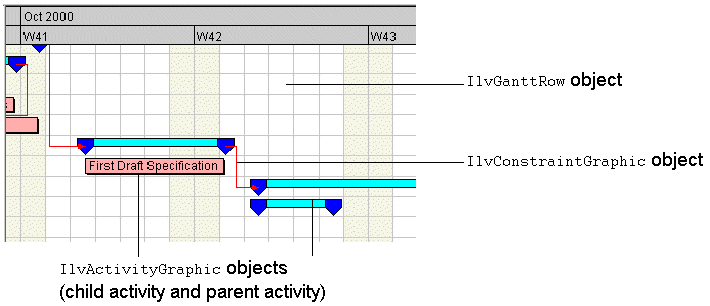
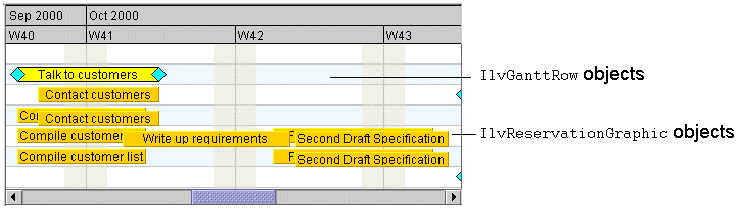
Gantt rows
A Gantt sheet consists of several rows, which are instances of the
IlvGanttRow class.
Rows have the following properties:
A Gantt row contains one or more activity graphics to represent activities.
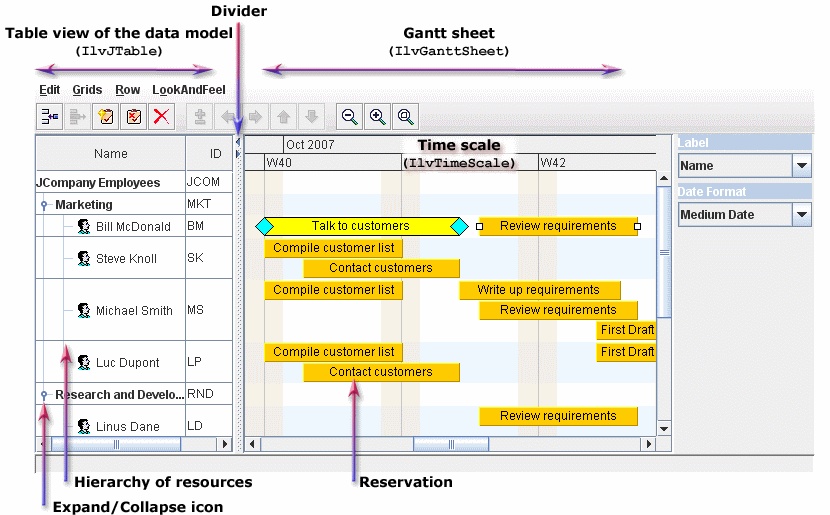
The following figure shows the Gantt sheet in a Schedule chart.
Activity graphics
Activity graphics are instances of the class
IlvActivityGraphic. They are designed to represent the associated activity, which can be accessed by calling the method
getActivity. An activity graphic is drawn as the result of a call to an activity renderer. (See the
Activity renderers section.) The activity renderer defined for an activity graphic can be accessed or changed by the
getActivityRenderer and
setActivityRenderer methods of the
IlvActivityGraphic class.
Activity renderers
Activity renderers are objects that implement the
IlvActivityRenderer interface to render activities. These objects work in association with the
IlvActivityGraphic class; when an activity graphic needs to be drawn, the
draw method of the
IlvActivityRenderer interface is called.
Rendering the data in the Gantt sheet
The data of a given Gantt data model is rendered differently depending on whether the Gantt sheet is in a Gantt chart or in a Schedule chart.
This section therefore distinguishes:
Activity Gantt sheet
In a Gantt chart, a Gantt row is configured to display only one activity. In other words, there cannot be more than one activity graphic in a Gantt row and the activity graphic cannot be moved to another row.
In a Gantt chart, the Gantt sheet is also configured to show constraints (instances of the interface
IlvConstraint) by default. See
Constraints for details.
In a Gantt data model, two activities can be linked by a constraint. In the Gantt sheet, constraints are represented by instances of the class
IlvConstraintGraphic.
For a given constraint graphic, the associated
IlvConstraint object can be obtained by calling the method
getConstraint. If one or both of the two activity graphics are not visible, the constraint graphic will not be visible either.
The following figure shows a Gantt sheet in a Gantt chart.
Resource Gantt sheet
In a Schedule chart, the Gantt sheet shows how each resource listed on the left has been scheduled. In other words, the Gantt rows in a Schedule chart display resource reservations. Because a resource can be reserved for more than one activity on a given time span, there can be more than one reservation on one row.
The following figure shows a Gantt Sheet in a Schedule chart.
Reservation graphics are instances of the class
IlvReservationGraphic. They are designed to render the reservation of resources, which are instances of the interface
IlvReservation. The class
IlvReservationGraphic is a subclass of the class
IlvActivityGraphic. For a given reservation graphic, the associated
IlvReservation object can be accessed by calling the method
getReservation.
In the general case, one activity may reserve several resources and appear as several reservation graphics in the Schedule chart. For this reason, constraints between activities are not displayed by default in the Schedule chart. If each activity reserves at most one resource, constraint links can be displayed in the Schedule chart by calling the
setDisplayingConstraints method.
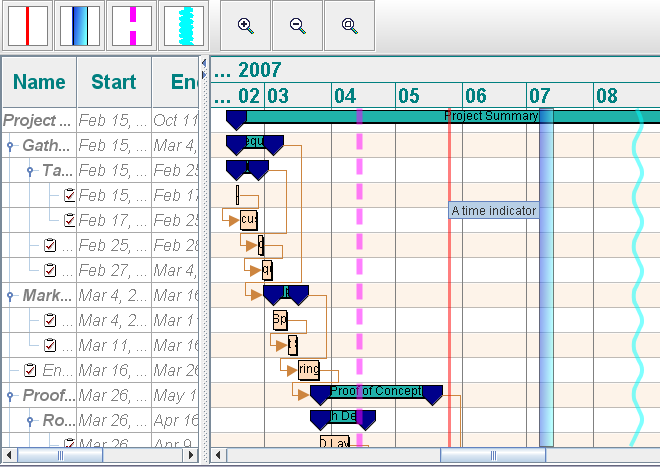
Time indicators
Time indicators let you highlight a specific time, such as the current time, over the grids in your Gantt sheet. Time indicators can be rendered by any kind of graphics, but the default graphic is a red line. Time indicators are drawn in a specific layer of the Gantt sheet.
This section refers to the following
Highlighting a specific time in the Gantt sheet code example. You can find the source code for this example in:
To add a time indicator to a Gantt sheet you need to:
1. Define your own renderer, if the default renderer is not suitable.
3. Customize the time indicator.
4. Add the time indicator to the Gantt sheet.
You can also control the visibility of time indicators through the specific layer on which they are placed.
Defining your renderer
A time indicator is rendered by an instance of a subclass of
IlvGraphic. The default renderer is an instance of
IlvLine with color red and width of 2.
To customize your renderer, choose one of the following options:
1. Customize the default renderer using the following code:
Example 1 – Customizing the default renderer
//Add the current time indicator. Customize it with some dashes, a width, and
//a color.
IlvLine line = new IlvLine(0, 0, 0, 100);
line.setLineWidth(6);
float[] lineStyle = {10.0f, 15.0f};
line.setLineStyle(lineStyle);
2. Define new renderers, such as
IlvGeneralPath, to get a more attractive appearance.
Example 2 – Customizing a renderer with IlvGeneralPath
//Add a fixed time indicator at 12 weeks from today with a customized renderer,
//using an IlvGeneralPath with some gradient paint.
IlvGeneralPath path = new IlvGeneralPath();
Color fillColor = new Color(20, 50, 225);
Color highlight = fillColor;
for (int i = 1; i <= 5; i++) {
highlight = highlight.brighter();
}
Color shadow = fillColor;
for (int i = 1; i <= 2; i++) {
shadow = shadow.darker();
}
Color[] colors = {fillColor, highlight, shadow};
float[] stops = {0, 0.25f, 1};
Point2D start = new Point2D.Float(0, 0);
Point2D end = new Point2D.Float(4, 1);
Paint fillPaint = new IlvLinearGradientPaint(start, end, stops, colors, true);
path.setFillPaint(fillPaint);
The following figure shows a selection of time indicators obtained by running the example.
Creating a time indicator
A time indicator uses an instance of
IlvGraphic to represent a specific time on the Gantt sheet.
The following classes are provided as subclasses of
IlvTimeIndicator:
IlvCurrentTimeIndicator for representing the current time. A timer is used to update the Gantt sheet as time passes.
To create customized time indicators, choose one of the following options:
1. Create a default time indicator at a specific time.
Example 3 – Creating a Default Time Indicator at a Specific Time
//Create a default fixed time indicator at 6 weeks from today.
//It will create a red line.
//The description "A time indicator" is given (and will be shown as a tooltip)
Date now = new Date();
Date time = IlvTimeUtil.add(now, IlvDuration.ONE_WEEK.multiply(6));
IlvFixedTimeIndicator timeIndicator =
new IlvFixedTimeIndicator(time, "A time indicator");
2. Create a time indicator at a specific time with a new renderer, such as an
IlvGeneralPath.
Example 4 – Creating a time indicator at a specific time with a new renderer
IlvGeneralPath path = new IlvGeneralPath();
...
IlvFixedTimeIndicator timeIndicator = new IlvFixedTimeIndicator(time, path,
"A second time indicator");
3. Create a time indicator of the current time, for example, with a customized renderer.
Example 5 – Creating an indicator of the current time with a customized renderer
IlvCurrentTimeIndicator currentTimeIndicator =
new IlvCurrentTimeIndicator(line);
Current time indicators have a default description that can be overridden.
Customizing a time indicator
The following table shows the properties of the time indicator that can be customized.
Property | Description |
time | Type java.util.date for the time that this time indicator represents. You cannot set the time for IlvCurrentTimeIndicator, since it is calculated automatically. |
maxWidth | The maximum width of the renderer. The default value is 2. |
alpha | The alpha value of the layer that holds the graphic object. The default value is 0.5F. |
toolTipText | The text displayed as a tooltip. The default text is the description of the time indicator. A null value disables the tooltip. |
When you instantiate your own renderer, there is a lot of scope for customizing the rendering of the time indicator. It can also be customized later. Alternatively, you can customize the default renderer.
Customization is achieved through the following properties applied to the underlying graphics:
foreground
fillOn
background
strokeOn
NOTE Setting these properties on some subclasses of IlvGraphic has no effect.
You can also control the refresh frequency of IlvCurrentTimeIndicator.
To set the maxWidth, strokeOn, and foreground properties.
Add the following code to your application:
Example 6 – Setting time indicator properties
timeIndicator = new IlvFixedTimeIndicator(time, spline, "A fourth time
indicator");
timeIndicator.setMaxWidth(15);
timeIndicator.setStrokeOn(true);
timeIndicator.setForeground(Color.cyan);
Adding a time indicator to the Gantt sheet
You can add a time indicator to the Gantt sheet in the following way:
sheet.addTimeIndicator (timeIndicator);
Other methods of
IlvGanttSheet allow you to have some control of time indicators or to manipulate them.
For example:
IlvTimeIndicator
getTimeIndicator to obtain the time indicator of a specific time or the current time indicator if a null date is passed.
The action IlvScrollToTimeIndicatorAction is provided to allow you to scroll easily to additional time indicators.
To instantiate this action:
Add the following code to your application:
Example 7 – Instantiating IlvScrollToTimeIndicator action
scrollToTimeIndicatorAction = new IlvScrollToTimeIndicatorAction(
sheet, timeIndicator, name, icon,
accelerator, shortDescription,
longDescription);
Activity layouts
A Gantt row in a Schedule chart is configured to render one or more resource reservations corresponding to one or more activities. If the default layout is enabled and the same resource is reserved for more than one activity, the multiple reservation graphics may overlap on the corresponding row. To avoid this and ensure a neat arrangement of the reservation graphics, an
IlvActivityLayout object is used by an
IlvGanttRow to compute the positions and z-order of its activity graphics.
The following activity layout implementations are provided:
You can also create your own custom implementation of the
IlvActivityLayout interface or subclass one of the provided implementations.
Use the following methods of IlvScheduleChart to access the activity layout of the chart:
IlvActivityLayout getActivityLayout() void setActivityLayout(IlvActivityLayout layout) Simple layout
All activity graphics on a given Gantt row have the same
y position. They are all aligned on the top of the Gantt row and have the same height. The layout does not change the stacking order of the activity graphics (
z axis). See
IlvActivitySimpleLayout.
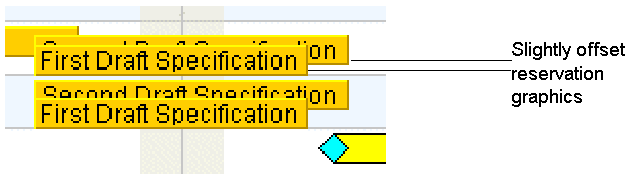
Pretty layout
The following figure shows the result of the Pretty layout option (see the fourth row, for example). The overlapping reservation graphics are arranged with a slight vertical offset. Also, the reservation graphics are stacked so that the higher one (the one that has the greater
y position) is displayed behind the lower one and both reservation graphics are visible. See
IlvActivityLogisticLayout.
The following figure shows reservation graphics in pretty layout.
Cascade layout
The Cascade layout is similar to the Pretty layout except that it does not change the stacking order (
z axis) of the activity graphics. See
IlvActivityLogisticLayout.
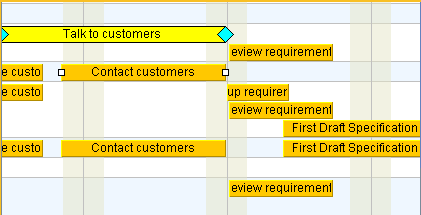
Tile layout
The following figure shows reservation graphics in Tile layout. The height of activity or reservation graphics does not change when they are displaced.
The Gantt row is divided into subrows, each one accommodating an activity or reservation graphic. The Gantt row can retain a constant height and the height of the subrows is determined by dividing this constant height by the number of subrows. Optionally, the row height can change to accommodate the layout of the graphics and the subrows maintain a constant height. In this case, attempting to set individual row heights on the chart does not work, since the layout overrides this behavior. See
IlvActivityTileLayout.
Copyright © 2018, Rogue Wave Software, Inc. All Rights Reserved.