Using Gantt and Schedule charts
This section describes how to control the appearance of the charts, manipulate rows, and control scrolling.

Elaborates the properties available to control the appearance of Gantt and Schedule chart beans.
Explains how activities and resources are displayed in a Gantt chart.
Annotates the methods use to control rows in a chart.
Describes how to control horizontal and vertical scrolling in the Gantt sheet.
Chart visual properties
The Gantt and Schedule chart beans have many properties that control their appearance. For example, to change the font used in the column headers of the table, you can use:
myChart.setTableHeaderFont(new Font(...));
If you want to change the foreground color of the horizontal time scale to blue you can use:
myChart.setTimeScaleForeground(Color.blue);
The following table shows the
IlvHierarchyChart methods that control the visual properties of the charts.
Property | Methods |
Background color | Color getTableBackground() |
void setTableBackground(Color color) |
Color getTableHeaderBackground() |
void setTableHeaderBackground(Color color) |
Color getGanttSheetBackground() |
void setGanttSheetBackground(Color color) |
Color getTimeScaleBackground() |
void setTimeScaleBackground(Color color) |
Fonts | Font getTableFont() |
void setTableFont(Font font) |
Font getTableHeaderFont() |
void setTableHeaderFont(Font font) |
Font getTimeScaleFont() |
void setTimeScaleFont(Font font) |
Foreground color | Color getTableForeground() |
void setTableForeground(Color color) |
Color getTableHeaderForeground() |
void setTableHeaderForeground(Color color) |
Color getTimeScaleForeground() |
void setTimeScaleForeground(Color color) |
Table grid | Color getTableGridColor() |
void setTableGridColor(Color color) |
Row height | int getRowHeight() |
void setRowHeight(int rowHeight) |
Divider | int getDividerLocation() |
void setDividerLocation(int location) |
int getDividerSize() |
void setDividerSize(int size) |
boolean isDividerOpaqueMove() |
void setDividerOpaqueMove(boolean opaqueMove |
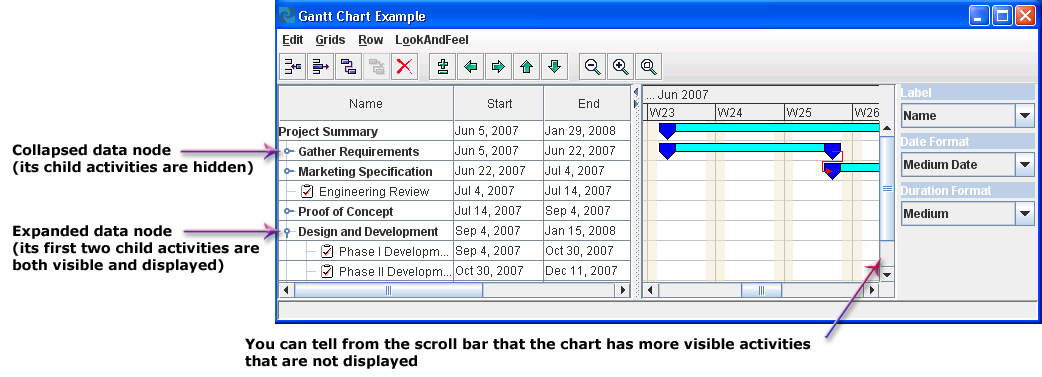
Expanding or collapsing and hiding or showing rows
For the rest of this discussion, an activity in an
IlvGanttChart or a resource in an
IlvScheduleChart is referred to as a
data node. This convention allows the common behavior of both charts to be described in a concise manner.
The following terms describe the visibility of data nodes and the rows they are displayed on:
An
expanded data node is one that is visible and shows its child nodes, making them visible also.
A
collapsed data node is one that hides its child nodes. A collapsed node may or may not be visible, depending on whether its parent node itself is expanded or not. If a data node has no child nodes, its expanded or collapsed status is undefined.
A
visible data node is a child of an expanded parent. It is represented by a row, but the user will see that row only if the display area is large enough.
A
displayed data node is one that is both visible—that is, its parent node is expanded—and currently within the display area, where it can be seen.
A
hidden data node is the opposite of visible. It is a child of a collapsed parent and is not represented by a row.
NOTE Scrolling through a window changes the display status of a row, not its visibility status.
The following figure shows the expanded/collapsed and visible/display statuses.
Controlling row structure and visibility
You can use the
IlvHierarchyChart methods listed in the following table to access and control the expand, collapse, and visibility status of the rows in a chart.
NOTE IlvHierarchyNode is the abstract superclass of both activities and resources.
The value used by the API will be an activity for an IlvGanttChart and a resource for an IlvScheduleChart.
The following table shows the methods to control the collapse, expand, and visibility status.
Property | Methods |
| IlvHierarchyNode getRootRow() |
Expand/Collapse | boolean isRowExpanded(IlvHierarchyNode row) |
void expandRow(IlvHierarchyNode row) |
void expandAllRows() |
void expandAllRows(IlvHierarchyNode row) |
void collapseRow(IlvHierarchyNode row) |
Visibility | int getVisibleRowCount() |
int getVisibleRowIndex(IlvHierarchyNode row) |
IlvHierarchyNode getVisibleRow(int rowIndex) |
boolean isRowVisible(IlvHierarchyNode row) |
Iterator visibleRowsIterator(IlvHierarchyNode rootRow) |
void makeRowVisible(IlvHierarchyNode row) |
Rectangle getVisibleRowBounds(int row) |
Rectangle getVisibleRowBounds(IlvHierarchyNode row) |
int getVisibleRowIndexAtPosition(int position) |
IlvHierarchyNode getVisibleRowAtPosition(int position) |
Displayed | int getDisplayedRowIndexAtPosition(int position) |
IlvHierarchyNode getDisplayedRowAtPosition(int position) |
void makeRowDisplayed(IlvHierarchyNode row) |
Scrolling in the Gantt sheet
Describes how to control horizontal and vertical scrolling in the Gantt sheet.
Horizontal scrolling
The time interval displayed by the Gantt sheet and the time scale above it can be modified by using the following methods:
Date getVisibleTime() void setVisibleTime(Date time) IlvDuration getVisibleDuration() void setVisibleDuration(IlvDuration duration) IlvTimeInterval getVisibleInterval() void setVisibleInterval(Date time, IlvDuration duration) Date getMinVisibleTime() void setMinVisibleTime(Date min) Date getMaxVisibleTime() void setMaxVisibleTime(Date max) IlvDuration getMinVisibleDuration() void setMinVisibleDuration(IlvDuration duration) The time interval displayed by the Gantt sheet and the time scale above it can be modified by using the following methods:
For example, you can scroll a chart horizontally to the beginning of an activity:
IlvActivity activity = ...
Date startTime = activity.getStartTime();
myChart.setVisibleTime(startTime);
In the Gantt and Schedule charts, a horizontal scroll bar is displayed below the Gantt sheet. By default, the scroll bar is visible.
You can change this by using the following methods of the class IlvHierarchyChart:
boolean isHorizontalScrollBarVisible() void setHorizontalScrollBarVisible(boolean visible) The horizontal scroll bar has two operating modes:
In the default
unbounded mode, there is no upper or lower limit to the scrolling. This is indicated by the
getMinVisibleTime and
getMaxVisibleTime methods returning
null. The user can use the scroll bar to move forward or backwards in time without limit. However, the scroll bar slider remains in the center of the scroll bar and retains a fixed size.
The
bounded mode is enabled when the methods
setMinVisibleTime and
setMaxVisibleTime have been called with non-null values. In this mode, the scroll bar is limited to the specified time interval and the slider size and position is proportional to the displayed time span.
Vertical scrolling
Vertical scrolling of the Gantt and Schedule charts can be performed using the vertical scroll bar on the right side of the Gantt sheet. By default, this scroll bar is visible only when it is needed.
You can use the following methods to change this behavior:
int getVerticalScrollBarPolicy() void setVerticalScrollBarPolicy(int policy) The class
IlvHierarchyChart has three static constants that define the supported scroll bar policies:
IlvHierarchyChart.VERTICAL_SCROLLBAR_AS_NEEDED IlvHierarchyChart.VERTICAL_SCROLLBAR_NEVER IlvHierarchyChart.VERTICAL_SCROLLBAR_ALWAYS For example, if you want the vertical scroll bar to be always visible, you can write:
myChart.setVerticalScrollBarPolicy(myChart.VERTICAL_SCROLLBAR_ALWAYS);
You can use the following methods to scroll the chart vertically:
int getMaxVerticalPosition() int getVerticalPosition() void setVerticalPosition(int position) int getVerticalExtent()
Copyright © 2018, Rogue Wave Software, Inc. All Rights Reserved.