Creating a complex renderer
Explains how to create a complex renderer using composite graphics.

Describes the composite graphics you will use to represent the activities in the chart.
Describes how to select the base element shape on which other graphic objects will be attached.
Describes how to change the shape of the selected base element and apply more sophisticated styling.
Describes how to add attachments when the container of the composite graphic objects is selected.
Explains how to attach an SVG graphic to the milestones in the chart.
Overview
In this section you will learn how to create a complex renderer by using composite graphics. In the Designer, you use composite graphics to represent the activities in the chart. Each composite graphic is made up of elements. You can put together existing graphic objects to construct new ones.
The following figure shows the composition of a complex renderer.
The Composite node in the hierarchy represents the envelope that contains all the graphic objects that make up the complex renderer.
The next node in the tree, activityRectangle1, is the base element to which all the other graphic objects that compose the complex renderer are attached. You cannot remove the base element.
The remaining nodes are graphic objects that are attached to the base element.
You can customize the attachments by playing with their properties. You can customize the complex renderer by adding new attachments and removing existing ones.
You must choose a graphic object as the base element of your composite to which to attach other graphic objects. The following base elements are available in the renderers of the Create Style Rule Wizard or Change Style Rule Wizard:
Simple rectangle
Rectangle with customizable paint
The paint facilities allow you to achieve more sophisticated rendering.
Shadow rectangle
Relief rectangle
The initial object is just a starting point; when you exit the wizard you can customize the object by setting properties, selecting a different image file, adding elements, and so on. You cannot delete the base element of a composite graphic object.
Then you can add elements to the composite graphic object by attaching other graphic objects to the base element. You can choose from:
Icon: A raster image file (
.gif,
.jpg, or
.png)
Shape: A geometric shape
SVG: A vector image file (
.svg)
Text: A text consisting of one or more lines
The example is based on projectResources.igpr located in:
<installdir>/jviews-gantt/bin/designer/data/examples.
In this section you will learn about:
Selecting a base element
You must select a base element shape to which to attach the other graphic objects to compose the complex renderer.
1. Select activity:leaf.
2. Right-click and choose Change Style Rule.
3. Select Yes.
4. Clear Generated Name and type the original name of this style rule.
5. Click Next to leave the condition unchanged and access the Renderer Mapping panel.
6. Select New renderer and click Next.
7. Select Base Elements.
8. Select Rectangle with customizable paint
9. 
10. and click Finish.
Styling the base element
You can change the shape of the selected base element and apply more sophisticated styling to the fill color and pattern with the Paint feature.
1. Select the rule activity:leaf and click the Graphic tab in the Styling Customizer.
You can see the container of the composite graphic with the base element of the graphic identified as activityShape.
The base element initially selected is a rectangle. You can change the shape by selecting a different geometric shape. However, the size of the activity shape is adjusted to the length of time that the activity it represents lasts. Therefore, the rectangular shape is particularly suited to this type of representation. You cannot change the shape of graphic objects that form attachments to the base element.
Since the shape of the base element is adjusted to the duration of the activity that it represents, the base element of a milestone, which is a zero-duration activity, is not displayed, regardless of any width or height settings in the Styling Customizer. The base element of a complex renderer of milestones serves only as the base to accept attachments, such as an icon. See
Applying composite rendering to milestones.
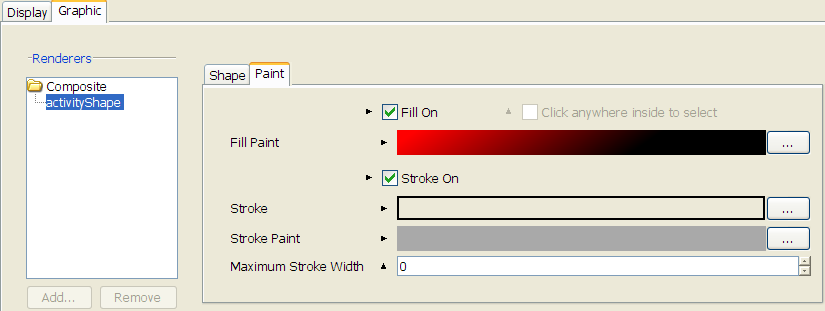
2. Click the Paint tab and click the ellipsis (...) in the Fill Paint field to access the Paint Editor.
3. Choose and Apply a different color and a linear gradient.
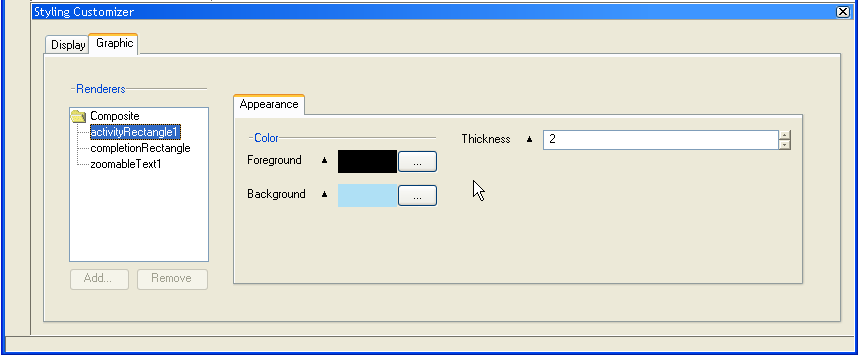
The following figure shows the paint styling of the base element of a complex renderer.
4. 
Adding attachments
You can add attachments when the container of the composite graphic objects is selected.
1. Select Composite and click Add.
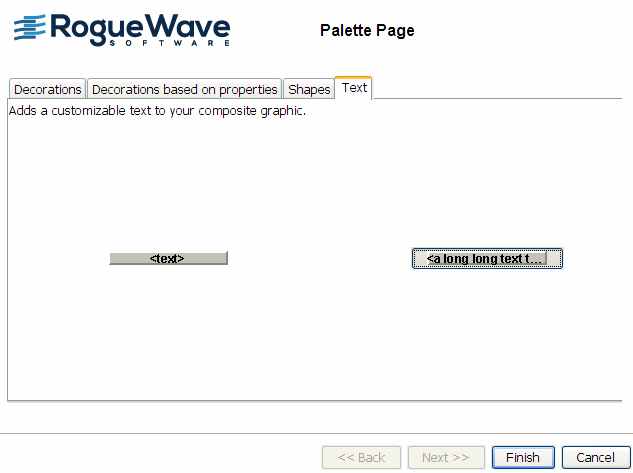
2. In the Palette, select the Text tab.
3. Select the long text that stays inside its container and click Finish.
The following figure shows the palette for text in composite graphics.
4. 
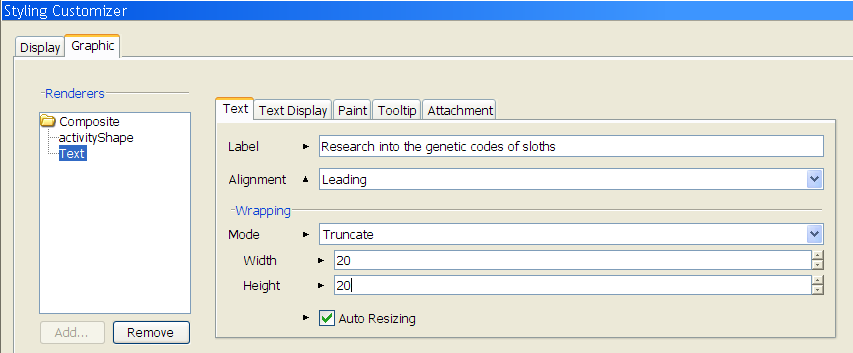
5. Select Text in the tree of composite graphic object attachments to style the attachment.
6. Select the Text tab and type a long text into the Label field and leave the rest of the settings unchanged.
The following figure shows how to style a text attachment.
7. 
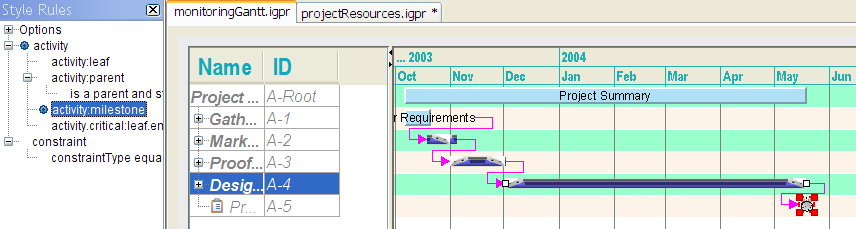
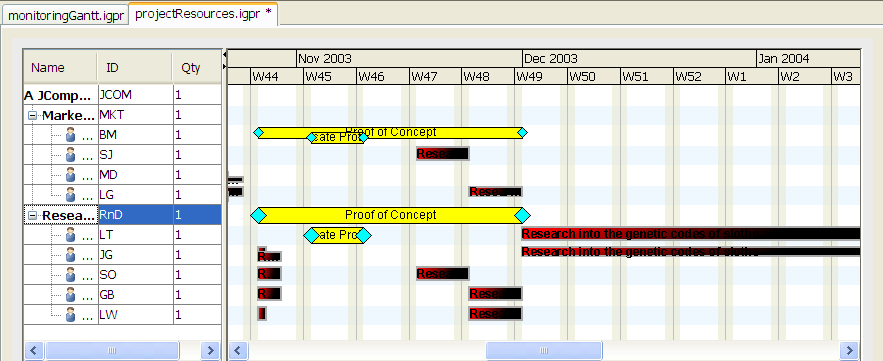
The following figure shows the result.
8. 
Experiment with the other Text property settings to see the effect in the chart. Refer to
Styling the Resource Data chart data in
Developing with the SDK for information on what the different properties are for. You can see the property names by choosing
View > Styling Properties in the Designer.
9. Select the container Composite and click Add.
10. In the Palette select the Decorations tab.
11. Select an icon and click Finish.
If you want to use your own icon, you must first complete the modifications to the rule. Then, with the rule selected, you can browse in the Styling Customizer to select the URL of the raster image file of the icon you want to use.
12. Select Icon in the tree of composite graphics objects.
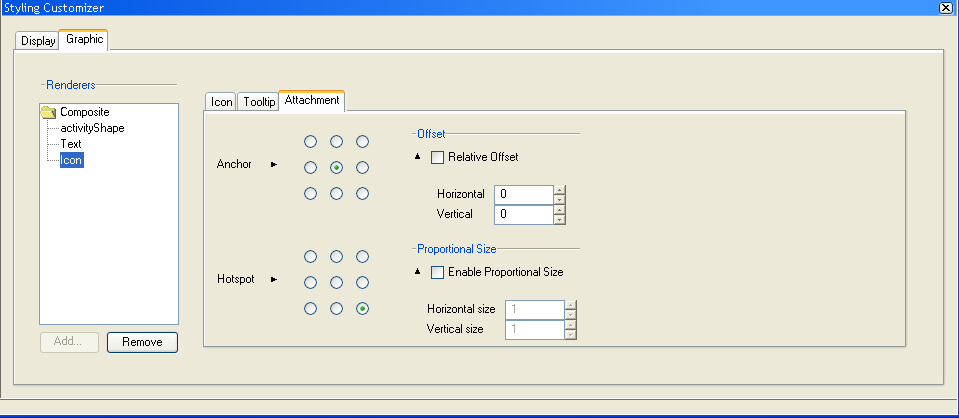
13. Select the Attachment tab and adjust the Hotspot attachment point to the lower right.
You need to specify two attachment points, one on the base element, the anchor, and one on the attachment itself, the hotspot. The position of the attachment point is specified in relation to left, right, or center, top, bottom, or center by means of the matrix selection.
The following figure shows how to attach an icon.
You can specify an icon to be used as a decoration by clicking the Icon tab and selecting the image location in the file browser.
You can remove a decoration by clicking Remove.
Applying composite rendering to milestones
In this example, you are going to attach an SVG graphic to the milestones in the chart. Open the project file that contains your customized monitoringGantt example.
1. Select the style rule activity:milestone.
2. Right-click and choose Change Style Rule.
3. Select Yes.
4. Clear Generated Name and type the original name of this style rule.
5. Click Next to leave the condition unchanged and access the Renderer Mapping panel.
6. Select New renderer and click Next.
7. Select Base Elements.
8. Select Simple rectangle and click Finish.
When the Graphic tab is selected in the Styling Customizer you can see that the base element activityRectangle1 has been added to the container of the composite graphic objects. Since milestones have zero duration, you cannot see the shape used to form the base element. There is no point in styling it by color or shape, since it will not be displayed in the chart. However, it must exist so that you can attach a visible item to it.
1. Select Composite and click Add.
2. In the Palette select the Decorations tab.
3. Select the graphic with SVG and click Finish.
If you want to use your own SVG file you must first complete the modifications to the rule. Then, with the rule selected, you can browse in the Styling Customizer to select the URL of the SVG file you want to use.
4. Select SVG in the tree of composite graphics objects.
5. Select the Attachment tab and make sure that the anchor point is set to center left.
The following figure shows the SVG attachment for milestone.
6. 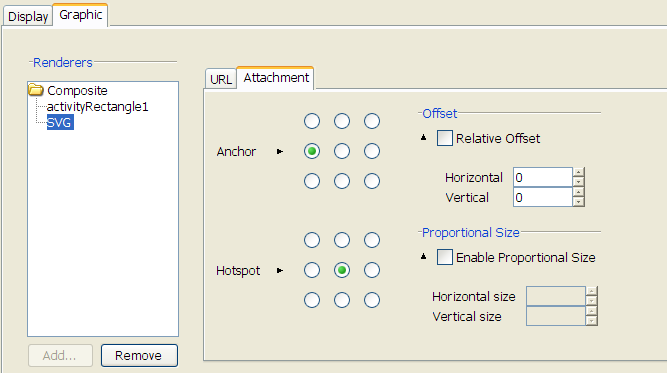
You must not center the anchor. Milestones have zero duration, so the Designer cannot calculate the center and therefore cannot display the graphic.
The following figure shows the result.
You can specify an SVG graphic to be used as a decoration by clicking the URL tab and entering the graphic location.
Copyright © 2018, Rogue Wave Software, Inc. All Rights Reserved.