Printing a chart with a custom document structure
Describes how to print an IlvChart with optional additional objects in a document (single or multipage) but without the automatic formatting capabilities that the flow mode offers.

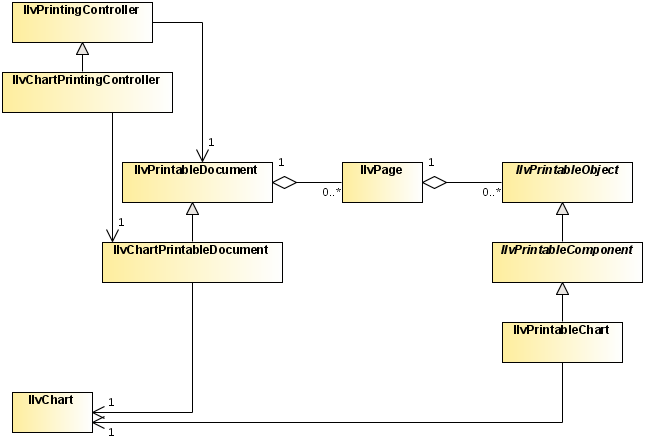
Describes the classes involved for printing a chart with a custom document structure.
Describes how the printing task is initiated and processed by an
IlvChartPrintingController instance.
Describes how to add additional printable objects to a page, and how to control the layout of the printable objects in a page.
The classes involved
As opposed to the flow printing mode, where both the document and the printing controller were instances of generic classes of the ilog.views.util.print package, the custom mode requires specialized subclasses to handle specific chart properties. These classes are:
The Classes Involved When Printing a Chart
The IlvChartPrintingController class
The printing controller controls the printing process. It initiates the printer job, handles the setup and the preview dialog boxes, and configures the document accordingly.
The IlvChartPrintableDocument class
The printable document stores the printed document structure and defines a set of parameters to customize the printing (the printed data window, the part of the chart to be printed, how the chart fits on the page, and so on). It is responsible for creating and populating the pages.
The following table lists the
IlvChartPrintableDocument properties.
Property | Methods | Default Value |
Printed data window | getDataWindow setDataWindow | |
Number of pages (for multipage document) | getMultiPageCount setMultiPageCount | |
Repeat x-scale title on all pages | getRepeatTitle setRepeatTitle | false |
Repeat y-scales on all pages | getRepeatYScales setRepeatYScales | false |
Resize mode | getResizeMode setResizeMode | FIT_TO_DIMENSION |
Scaling Alignment | getScalingAlignment setScalingAlignment | XMID_YMID |
Resolution scale factor | getResolutionScaleFactor setResolutionScaleFactor | MEDIUM_RESOLUTION |
Printed component | isPrintingChart setPrintingChart | |
Printed Data Window
This property specifies the data window to print. By default, the printed data window corresponds to the
data range of the chart default coordinate system.
Number of Pages for Multipage Document
The JViews Charts printing framework provides support for multipage printing through the multiPageCount property.
A multipage printing consists of dividing the x-range of the printed data window in successive intervals with respect to the number of pages. You can change the way the data window of a page is computed by overriding the
computeDataWindow method.
Repeat X-Scale Title on all Pages
When the x-scale title placement is other than 0 or 100 (that is, the axis extremities), this property sets whether the title has to be printed on each page of the document.
Repeat Y-Scales on all Pages
This property sets whether y-scales with a minimum or maximum crossing value (that is, positioned on the axis extremities) need to be printed on each page of the document.
Resize Mode
To determine the printed chart size, the IlvChartPrintableDocument defines two resizing modes:
Fit to the dimension of the printable area.
The chart is expanded to fill the printable area in both dimensions. The original proportions between the chart objects are not preserved. This mode corresponds to the IlvChartPrintableDocument.FIT_TO_DIMENSION constant.
Scale to the dimension of the printable area.
The chart is expanded in both dimensions proportionally, until the nearest page margins are reached. The original proportions between the chart objects are preserved. This mode corresponds to the IlvChartPrintableDocument.SCALE_TO_DIMENSION constant.
The following figure illustrates the result of these two modes:
Scaling Alignment
When the resize mode property is set to SCALE_TO_DIMENSION, the scalingAlignment property indicates the method to use when the aspect ratio of the chart does not match the aspect ratio of the printable area. The following figure shows the result for the different values depending on the destination printable area. The default value is XMID_YMID, that is, the chart is centered within the printable area.
Scaling Alignment
Resolution Scale Factor
Because the printer resolution is usually higher than the screen resolution, there may be some discrepancies between the screen appearance and the printing result. This is particularly true for labels, whose font size may not be adapted for printing. To reduce this effect, an additional scale transform may be applied on the printing graphics context when drawing the chart area.
There are three predefined resolution scale factors:
High (
IlvChartPrintableDocument.HIGH_RESOLUTION )
Medium (
IlvChartPrintableDocument.MEDIUM_RESOLUTION )
Low (
IlvChartPrintableDocument.IDENTITY_RESOLUTION )
where the low resolution scale factor is the identity transform.
The default value is Medium.
Printed Component
This property defines which chart, or chart area, is printed. Printing a chart means that all the components added to an IlvChart object will be printed. This includes the header, the footer, and the legend. Conversely, printing only the chart area means that all the other chart components, including the legend, will be ignored.
The default value is true. This means that the whole chart is printed.
NOTE All these properties are also accessible in the Chart Setup tab of the Page Setup dialog box.
The IlvPrintableChart class
The printable object prints the
IlvChart within a region of the printable area of an
IlvPage. The
resizeMode document property determines how the chart fills the region.
How it works
This can be done either:
by code
or
from a GUI request
When a printing task is initiated, the document associated with the printing controller is prepared for printing: the pages are initialized with the printable objects and added to the document.
Handling pages
The pages of a chart document are instances of the
IlvPage class. They handle a collection of printable objects, instances of
IlvPrintableObject.
Populating a page
The pages are created in an
IlvChartPrintableDocument by means of the
createPages factory method. By default, a page contains one
IlvPrintableChart. If you want to add additional printable objects to the page, you may override the
createPages method.
For example, assume that you want to add a border on the page. The
ilog.views.util.print package provides the
IlvPrintableRectangle class to print a rectangle. What you have to do is to add such an object to the page after the chart has been added, by subclassing
IlvChartPrintableDocument and overriding the
createPages method to add an instance of
IlvPrintableRectangle.
The code is:
class MyChartDocument extends IlvChartPrintableDocument {
protected IlvPage[] createPages() {
IlvPage[] pages = super.createPages();
for (int i=0 ; i<pages.length ; ++page)
pages[i].addPrintableObject(new IlvPrintableRectangle(getImageableBounds()));
return pages;
}
}
First invoke the method of the mother class, so that the chart is added in the first position. Then, add a new instance of IlvPrintableRectangle to each page.
Computing the data window of a page
As mentioned in
Number of Pages for Multipage Document, a chart can be printed as a multipage document. Such a document creates as many pages as specified, and divides the data window to print into as many successive data windows. Each page prints its corresponding data window. By default, the splitting is performed along the data window x-range, with a y-range equal to the printed data window y-range. This computation is done in the
computeDataWindow method, which you can override to apply your own policy.
Printing the chart: the printing context
An IlvChartPrintableDocument prints, in an IlvPage, a given data window of the data model of an IlvChart, as it would be displayed by this chart.
To avoid affecting the appearance of the printed chart by modifying its configuration, the JViews Charts printing framework introduces the concept of
printing context through the abstract
IlvChartPrintContext class. The purpose of a printing context is to define a drawing configuration for a chart, independent of its current state. There is one printing context per printable chart, and each context defines the printing of each page.
Mainly, a chart context defines:
the print range of a given axis,
the visibility of the drawable objects of the printed chart,
the visibility of the title of a scale.
The print range of each axis of a chart is handled by the abstract
getRange method. This method returns the range to print for a specified axis, and a default implementation is provided by the
IlvDefaultChartPrintContext class. The default policy returns the corresponding range of the printed data window of the current page (see the section
Computing the data window of a page) for the default coordinate system axis and the data range of the axis for other coordinate systems.
The visibility of the chart drawable objects during a printing may be defined independently of the current chart state by means of the
isVisible method. The default policy takes care of only y-scales, their visibility depending on the value of the document
repeatYScales property and on the scales anchor.
Finally, the scale title visibility is checked using the
isTitleVisible method. The default implementation takes care of only the x-scale title, checking whether the title must be repeated on each scale according to the title placement along the axis and to the document settings.
Customizing the printing of a chart
This example is extracted from the
tablemodel demo. You can find the complete source code of this example in
<installdir>/jviews-charts/samples/tablemodel/src/tablemodel/TableModelDemo.java.
NOTE Only the code related to the printing is shown.
The requirements are:
a title at the top of the page,
a chart in the top-middle part of the page,
the table at the bottom middle part of the page.
The title is printed using an
IlvPrintableLabel object. This object is added to the top of the page, centered horizontally.
The chart is printed using an IlvPrintableChart. It fills horizontally the printable area of the page, and extends vertically half of the printable area height of the page.
Finally, the table is rendered in two parts: first the header, using an
IlvPrintableTableHeader and the table itself, using an
IlvPrintableTable.
Creating the document class.
Use the following code:
public class TablePrintableDocument extends IlvChartPrintableDocument
{
private JTable table;
public TablePrintableDocument(String name,
JTable table,
IlvChart chart)
{
super("test_chart",
chart,
false,
1,
false,
new IlvDataWindow(chart.getXAxis().getDataRange(),
chart.getYAxis(0).getDataRange()),
new PageFormat());
this.table = table;
// Initialize the page format.
getPageFormat().setPaper(new Paper());
getPageFormat().setOrientation(PageFormat.LANDSCAPE);
}
}
Populating the document pages with the label and the table.
1. Add additional objects to a page of a document by overriding the
createPages method:
protected IlvPage[] createPages()
{
IlvPage[] allPages = super.createPages();
IlvUnit.Rectangle pageArea = getImageableBounds();
for (int i=0; i<allPages.length; ++i) {
IlvPage page = allPages[i];
...
}
return allPages;
}
2. Add a printable label, placed at the top of the chart and centered horizontally:
for (int i=0; i<allPages.length; ++i) {
IlvPage page = allPages[i];
if (title != null) {
IlvPrintableLabel prnLabel = new IlvPrintableLabel(title, titleArea);
page.addPrintableObject(prnLabel);
}
...
}
3. Add the table header:
double chartHeight = getChartHeight(pageArea);
double headerX = pageArea.getX();
double headerY = titleArea.getY()+titleArea.getHeight()+chartHeight;
JTableHeader header = table.getTableHeader();
double headerHeight = header.getHeight();
double headerWidth = pageArea.getWidthAs(IlvUnit.POINTS);
if (headerHeight == 0 )
headerHeight = header.getPreferredSize().height;
int startCol = pageIdx*table.getModel().getColumnCount() / getMultiPageCount();
int endCol = (pageIdx+1)*table.getModel().getColumnCount() / getMultiPageCount()-1;
IlvUnit.Rectangle headerArea = new IlvUnit.Rectangle(headerX,
headerY,
headerWidth,
headerHeight,
IlvUnit.POINTS);
page.addPrintableObject(new IlvPrintableTableHeader(header,
headerArea,
startCol,
endCol));
4. Add the table itself:
double tableY = headerY + headerHeight;
IlvUnit.Rectangle printArea =
new IlvUnit.Rectangle(headerX,
tableY,
headerWidth,
pageArea.getHeightAs(IlvUnit.POINTS)-chartHeight-2*headerHeight,
IlvUnit.POINTS);
page.addPrintableObject(new IlvPrintableTable(table,
printArea,
startCol,
endCol,
0,
table.getModel().getRowCount() -1));
...
The following picture shows the final result:
Copyright © 2018, Rogue Wave Software, Inc. All Rights Reserved.