Printing a chart in a flow
Describes how to print IlvChart objects in a printing flow that contains other printable objects. This mode supports complex page format (paragraph alignment, local fonts, and so on) and is particularly well suited for reporting.

Introduces the concept of flow.

Describes the features available through the
IlvChartFlowObject class.

Shows how to create a printing flow, mixing charts and text.
Flow
A flow consists of a list of printable objects of different types (text, charts, manager, and so on) that are printed sequentially in a document.
Flow objects are instances of the
ilog.views.util.print.IlvFlow class and are directly obtained from the printable document by means of the
getFlow method.
NOTE There is only one flow per document.
A flow object is responsible for creating the document pages and defining their layout by positioning the printable object according to the pages, paragraphs, and text formats defined in the flow.
Creating a flow involves the following steps:
1. Create a document and a printing controller.
2. Get the document flow object using the IlvPrintableDocument.getFlow method.
3. Add the printable objects to the flow using the appropriate IlvFlow.add methods.
The IlvChartFlowObject class
The printing of an
IlvChart in a flow is performed by a specialized printable object, which is an instance of the
IlvChartFlowObject class.
This class allows you to specify the size of a printed chart in two different ways:

As a fixed size in paper coordinates.
The fixed size must be expressed in the page coordinate system. It is specified as an
ilog.views.util.print.IlvUnit.Dimension object and might be of any units supported by the
IlvUnit class.
For example, the following code prints an IlvChart, which is 7 cm wide and 5 cm high:
IlvChartFlowObject flowChart =
new IlvChartFlowObject(chart,
new IlvUnit.Dimension(7,5, IlvUnit.CM);

As a percentage of the page dimensions.
In this mode, one dimension is specified as a percentage of the corresponding page dimension, while the other one is automatically computed according to a specified aspect ratio. You can specify the size either in the constructor or by means of the
setPercentWidth and
setPercentHeight methods.
Printing a chart in a flow
NOTE Only the code related to the printing is shown.
Creating the document and the printing controller.

Use the following code:
IlvChart chart = ...;
IlvPrintableDocument document =
new IlvPrintableDocument("ChartInFlow");
IlvPrintingController controller =
new IlvPrintingController(document);
Constructing the flow.

Get the flow object of the document you have just created:
IlvFlow flow = document.getFlow();
Populate it.
1. Add a title, with a center alignment.
IlvFlow.TextStyle style = new IlvFlow.TextStyle();
style.setAlignment(IlvFlow.TextStyle.CENTER_ALIGNMENT);
style.setFont(new Font("Dialog", Font.PLAIN, 20));
flow.setTextStyle(style);
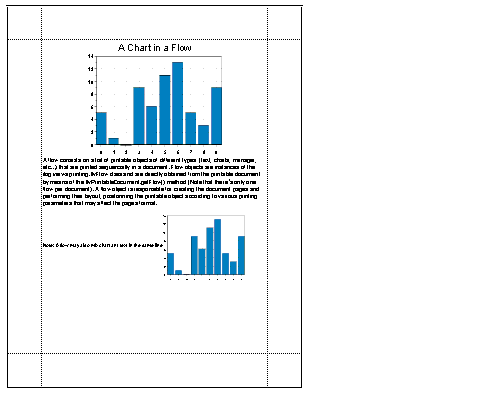
flow.add("A Chart in a Flow");
2. Add a chart in a new paragraph.
Its size will take 60% of the page width, with an aspect ratio between the width and height equal to 0.75:
flow.newLine();
IlvChartFlowObject printChart =
new IlvChartFlowObject(chart, flow, 60, 0, .75f);
flow.add(printChart, IlvFlow.BOTTOM_ALIGNMENT);
3. Add text below the chart as a new paragraph, left aligned.
style.setAlignment(IlvFlow.TextStyle.LEFT_ALIGNMENT);
style.setFont(new Font("Dialog", Font.PLAIN, 12));
flow.setTextStyle(style);
flow.newLine();
String text = ...;
flow.add(text);
4. Add a new paragraph containing a chart and text on the same line.
The chart is 6 cm wide and 5 cm high, centered vertically on the text baseline.
style.setFont(new Font("Dialog", Font.PLAIN, 10));
flow.setTextStyle(style);
flow.newLine();
text = ...;
flow.add(text);
printChart =
new IlvChartFlowObject(chart, flow, new IlvUnit.Dimension(6,5, IlvUnit.CM));
flow.add(printChart, IlvFlow.CENTER_BASELINE);
Here is a picture showing the final result:
Copyright © 2018, Rogue Wave Software, Inc. All Rights Reserved.
