The IlvChart bean
Describes the properties defined by the IlvChart bean, in addition to the inherited JComponent properties.

Describes the chart general properties.
Describes the legend properties.
Describes the axis properties.
Describes the scale properties.
Describes the graphical representation properties.
Describes the interaction properties.
Describes the data properties.
General properties
Property | Description | Default value |
xGridVisible | Controls the abscissa grid visibility | true |
yGridVisible | Controls the ordinate grid visibility | true |
header | The text to display on top of the chart area | empty |
footer | The text to display at the bottom of the chart area | empty |
antiAliasing | Controls the anti-aliasing mode inside the chart area | false |
antiAliasingText | Controls the anti-aliasing mode of text inside the chart area | false |
chartAreaBorder | The border to set on the chart area component | null |
plotAreaBackground | The background color of the plot area | white |
Grid visibility
The xGridVisible and yGridVisible properties indicate whether the abscissa grid or the ordinate grid should be drawn. A grid is drawn below the graphical representations of the data, and match the major steps location of their associated scale. By default, both grids are visible.
Grid Visibility shows a chart with a hidden abscissa grid, and a visible ordinate grid:
Grid Visibility
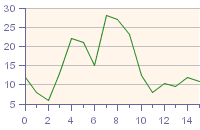
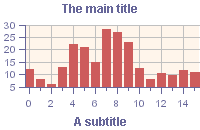
Header and footer text
The header and footer properties indicate that a text can be displayed on top of the chart area, and at the bottom of the chart area, respectively. This string can be expressed as simple text or as HTML text. By default, these properties are set to an empty string.
Header and Footer shows a chart with the
header property set to “The main Title” and the
footer property set to “A subtitle”:
Header and Footer
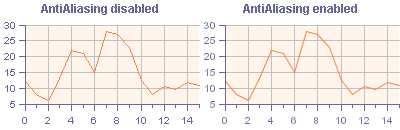
Anti-aliasing modes
The anti-aliasing mechanism allows you to have a nice display rendering by reducing stair effects on the display area. The IlvChart bean supports two anti-aliasing modes by means of two properties:
antiAliasing Controls the rendering quality of all the drawings performed within the chart area, except text drawings.
antiAliasingText Controls the rendering quality of all the text drawings performed within the chart area.
Since the anti-aliasing mechanism may be a time-consuming process, both modes are disabled by default.
Anti-aliasing shows two charts: the first one has the
antiAliasing property set to
false, the second one has the
antiAliasing property set to
true:
Anti-aliasing
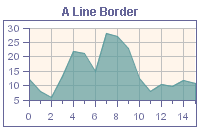
Chart area border
The IlvChart bean allows you to apply a javax.swing.Border instance of the chart area component by means of the chartAreaBorder property. By default, no border is set.
A Line Border Instance shows a chart area with a
LineBorder instance:
A Line Border Instance
Plotting area background
The plotting area is defined as the region where data is projected and displayed. The bounds of this rectangle are computed according to the drawing rectangle (the chart area bounds minus its internal insets) and the chart area internal margins.
The plotAreaBackground property describes the background color of this plotting rectangle, and is set to white by default.
Plotting Area Background shows two charts with a plotting area background color set to "255, 245, 235":
Plotting Area Background
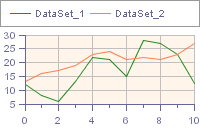
Legend properties
Property | Description | Default value |
legendVisible | Controls the legend visibility | false |
legendPosition | Controls the legend position within the chart | North |
Legend visibility
The IlvChart bean may be associated with a legend to display information about the drawn data. When this legend is enabled, all the graphical representations displayed within the chart have a corresponding legend item.
The legend is activated by means of the legendVisibility property, and is disabled by default.
Legend position
The chart legend is displayed at predefined positions within the chart around the chart area. These anchor positions are defined relative to the chart area, and the possible values are: North, North West, West, South West, South, South East, East, and North East.
The legend anchor position is defined by the legendPosition property, and is set to North by default.
Legend shows a chart with a
legendVisible property set to
true and the
legendPosition property set to
North:
Legend
Axis properties
Property | Description | Default Value |
projectorReversed | Controls the projector configuration | false |
xAxisReversed | Controls the abscissa axis orientation | false |
yAxisReversed | Controls the ordinate axis orientation | false |
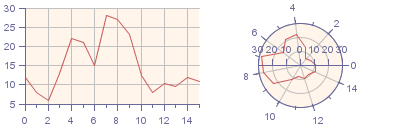
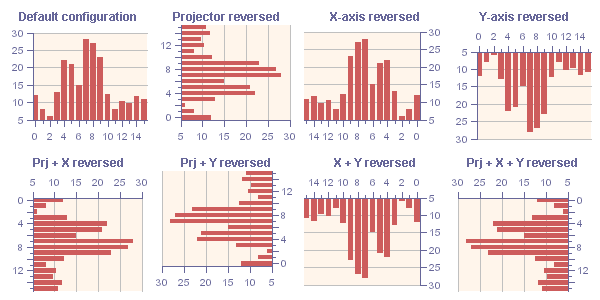
Axis configuration
The IlvChart beans allow you to customize the chart axis configuration by means of three different properties that work together to define the coordinate system configuration:
projectorReversed Allows you to change the meaning of the abscissa and ordinate coordinates of a point. For example, a reversed Cartesian projector will project x-data values along the y-axis of the screen.
xAxisReversed Allows you to change the orientation of the x-axis.
yAxisReversed Allows you to change the orientation of the y-axis.
The combination of these three properties determines the full configuration of the chart coordinate system.
Axis shows the possible configurations and their results:
Axis
Scale properties
Property | Description | Default value |
xScaleVisible | Controls the abscissa scale visibility | true |
yScaleVisible | Controls the ordinate scale visibility | true |
xScaleTitle | Defines the abscissa scale title | none |
yScaleTitle | Defines the ordinate scale title | none |
xScaleTitleRotation | Defines the abscissa scale title rotation | 0 |
yScaleTitleRotation | Defines the ordinate scale title rotation | 0 |
Scales visibility
A scale is defined as the graphical representation of an axis. Scale objects are directly handled by the IlvChart bean that creates one scale per axis.
The visibility of the chart scales is controlled by means of the xScaleVisible and yScaleVisible properties. By default, both x- and y-scales are visible.
Scales Visibility shows a chart with the hidden scales:
Scales Visibility
Scales title
The IlvChart bean allows you to associate a title with each scale of the chart. A scale title is defined by the following elements:
the text
Displayed through the xScaleTitle and yScaleTitle properties that are initialized to an empty string by default.
a rotation angle
Defined through the xScaleTitleRotation and yScaleTitleRotation properties that are initialized to 0.
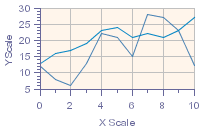
Scales Title shows a chart with the
xScaleTitle property set to “X Scale”, the
yScaleTitle set to “Y Scale”, and the
yScaleTitleRotation property set to -90:
Scales Title
Graphical representation properties
Property | Description | Default value |
type | Defines the chart type | Cartesian |
renderingType | Defines the type of the graphical representation of a data model | Polyline |
To determine how a data model is rendered on the screen, the IlvChart beans define the following two properties:
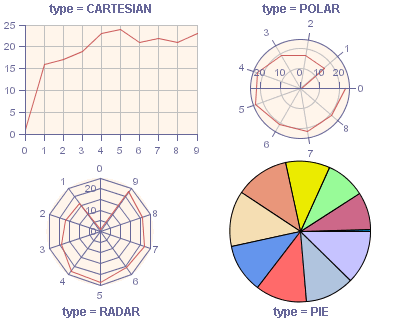
type Determines how data is projected (using either a Cartesian or polar projection). The possible values are: Cartesian, Polar, Radar, and Pie.
Chart Types shows the possible values of the
type property:
Chart Types
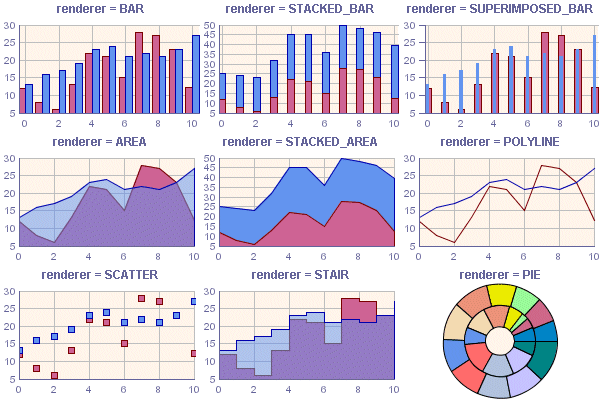
renderingType defines the graphical representation of a data model (as polylines, bars, stairs, and so on.). The possible values are: Bar, Stacked Bar, SuperimposedBar, Area, Stacked Area, Polyline, Scatter, Stair, and Pie.
NOTE The Pie Renderer type is essentially used with a Pie chart.
Renderers shows the Cartesian charts with the different graphical representations:
Renderers
Interaction Properties
Property | Description | Default value |
interactors | Defines the possible interactions that are handled by this chart bean | none |
xScrollBar | Defines the scroll bar associated with the x-axis | none |
Interactor properties
The JViews Charts library provides a built-in mechanism to handle the user’s interactions on an IlvChart bean. User’s interactions are performed by means of objects called interactors.
The interactors define atomic behaviors (like zooming or panning) that can be combined to achieve complex interactions.
Interactors are handled by an IlvChart bean by means of the interactors property, defined as an array of interactors.
The predefined interactors available to the IlvChart bean are: Zoom, Information-View, Pan, Highlight-Point, X-Scroll, Y-Scroll, Edit-Point, Action, and 3DView.
For more information on these interactors, you can refer to
Interacting With Charts.
xScrollBar property
The
xScrollBar property allows you to connect a
JScrollBar object to the
x-axis of an
IlvChart bean. Once connected to an
IlvChart bean, the scroll bar is able to scroll the
visible range of the chart, and is updated following any modifications of the visible range.
Data properties
You can import data in an IlvChart by means of a data source. A data source is an object that holds the data sets to be displayed in a chart. An IlvChart bean is connected to a data model through its data source property.
You can find more information on the data model architecture in
Using the Data Model.
Copyright © 2018, Rogue Wave Software, Inc. All Rights Reserved.