Chart Interactors
Describes the interactors defined in the JViews Charts library. For each chart interactor, you will find a table that includes the registered name of the interactor, the default key or button used for the interaction, and the action that is performed when using the interactor.

Introduces the chart interactors with a brief description of each.
Describes the zoom interactor.
Describes the x-scroll interactor.
Describes the y-scroll interactor.
Describes the pan interactor.
Describes the action interactor.
Describes the local pan interactor.
Describes the local reshape interactor.
Describes the local zoom interactor.
Describes the edit-point interactor.
Describes the highlight-point interactor.
Describes the information-view interactor.
Describes the pick-data-points interactor.
Describes the treemap focus interactor.
Introduction to the chart interactors
Each chart interactor (subclasses of
IlvChartInteractor) implements a given type of interactive operation: scrolling, zooming, editing, or highlighting data points.
Thanks to this clean separation, chart interactors are lightweight and well-defined event-handling entities that can be easily customized.
The base class used to define the behavior of a chart in response to a given action by the user is the IlvChartInteractor class.
The JViews Charts package provides a comprehensive set of predefined interactors.
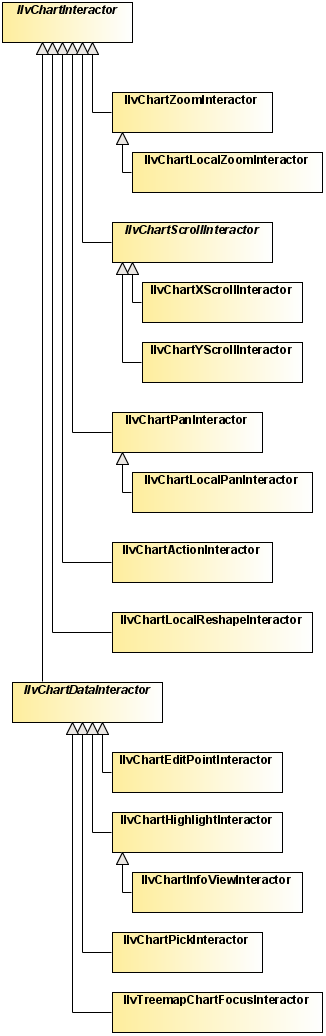
Some of these interactor classes inherit directly from the IlvChartInteractor class:
Other subclasses inherit from the
IlvChartDataInteractor class, a subclass of
IlvChartInteractor that specifically deals with interactions on the data points of the chart:
IlvChartInfoViewInteractor inherits from the
IlvChartHighlightInteractor class and displays information about a data point whenever the mouse moves over the data point in the data display area.
IlvChartPickInteractor triggers an interaction event whenever a data point has been picked in the data display area.
Predefined Interactors Hierarchy
NOTE The precision that is currently used to find the data point corresponding to a given screen point is computed by an
IlvChartDataPicker object. By default, all
IlvChartDataInteractor subclasses use an
IlvDefaultChartDataPicker instance that uses a Euclidian distance between two points. The way the distance is computed can be changed by overriding the
computeDistance method. To use your own
IlvChartDataPicker class in your interactors, override the
createDataPicker method so that it returns an instance of your own class.
All default interactors have an associated shortcut name that allows the instantiation of the interactor class by its name. This mechanism is used by the JavaBeans to instantiate the interactor chosen by the user in the property editor of the interactors.
The following interactors are defined in the JViews Charts library:
Zoom interactor
A zoom interactor has the following basic characteristics:
Class | |
Registered name | “Zoom” |
Default Key or Button | Left mouse button to zoom in, Shift + Left mouse button to zoom out. |
Action | Lets the user trigger a zoom-in or a zoom-out command by dragging a box within the data display area of a chart. This box indicates the area to be zoomed in or zoomed out. |
The zoom-in interaction is started by pressing the left mouse button by default. However, this button can be changed to any other button or key-button combination by passing the corresponding event mask as a parameter to the constructor of the zoom interactor, or by means of the
setZoomInEventMask method.
The zoom-out interaction is started by pressing the Shift Key + left mouse button by default. However, this combination can be changed to any other button or key-button combinations by passing the corresponding event mask as a parameter to the constructor of the zoom interactor, or by means of the
setZoomOutEventMask method.
The zoom-out operation is performed by starting the interaction and by dragging a box within a chart area. This box indicates the projection area of the current visible area, so that what you currently see is projected within this rectangle.
NOTE You can control the zoom-out level with the size of the rectangle, as for the zoom in. For example, drawing a very small rectangle produces a big zoom out. If you have dragged a rectangle to zoom in, dragging the same rectangle in zoom-out mode returns to the previous visible data window.
Each zoom-in/zoom-out operation can be broken down into several steps to render a smooth transition between the original and the final visual state of the displayed data. When a zoom interactor instance is created, the default number of steps is set to 10. You can specify the number of steps by means of the
setAnimationStep method.
The zoom action can be performed either on a specific or both axes of a coordinate system. When an interactor instance is created, zooming along the
y-axis is disabled by default. You change this behavior by means of the
setYZoomAllowed and
setXZoomAllowed methods.
The cursors used during zoom-in and zoom-out operations can be changed by overriding the
getZoomInCursor and
getZoomOutCursor methods to return other cursors.
X-scroll interactor
An x-scroll interactor has the following basic characteristics:
Class | |
Registered name | “XScroll” |
Default Key or Button | Left Arrow key to scroll in the negative direction, right arrow key to scroll in the positive direction. |
Action | Lets the user scroll through the displayed data along the x-axis. |
The default keys used to scroll are the Left Arrow key for negative direction and right arrow key for positive direction. However, these keys can be changed by passing other key codes as parameters to the constructor of the
x-scroll interactor, or by means of the
setPositiveDirectionKey and
setNegativeDirectionKey methods.
Y-scroll interactor
An y-scroll interactor has the following basic characteristics:
Class | Inherits from IlvChartScrollInteractor |
Registered name | “YScroll” |
Default Key or Button | Up arrow key to scroll in the positive direction, down arrow key to scroll in the negative direction. |
Action | Lets the user scroll through the displayed data along the y-axis. |
The default keys used to scroll are the up arrow key for positive direction and bottom arrow key for negative direction. However, these keys can be changed by passing other key codes as parameters to the constructor of the y-scroll interactor, or by means of the IlvChartScrollInteractor.setPositiveDirectionKey and IlvChartScrollInteractor.setNegativeDirectionKey methods.
Pan interactor
A pan interactor has the following basic characteristics:
Class | |
Registered name | “Pan” |
Default Key or Button | Right mouse button. |
Action | Lets the user scroll through the displayed data by dragging the mouse in any direction. |
The mouse button used to scroll through the displayed data is the right mouse button by default. However, this button can be changed to any other button or key-button combination by passing the corresponding event mask as a parameter to the constructor of the pan interactor or by means of the
setEventMask method.
The pan action can be performed either on a specific or both axes of a coordinate system. When an interactor instance is created, the panning along the
y-axis is disabled by default. You can change this behavior by means of the
setYPanAllowed and
setXPanAllowed methods.
By default, the cursor used when the mouse is dragged is the predefined
Cursor.MOVE_CURSOR. However, to return another cursor you can override the
getCursor method.
Action interactor
An action interactor has the following basic characteristics:
Class | |
Registered name | “ChartAction” |
Default Key or Button | ‘Z’ key to zoom in, ‘U’ key to zoom out, ‘F’ key to fit. |
Action | Lets the user execute an IlvChartAction when a specific key is pressed. |
The action to trigger when a key has been pressed is determined by means of the
getAction method. You can change the default association by overriding this method to return your own actions.
Local pan interactor
A local pan interactor has the following basic characteristics:
Class | |
Registered name | “LocalPan” |
Default Key or Button | Right mouse button. |
Action | Lets the user scroll the zoomed data window of an IlvLocalZoomAxisTransformer by dragging the mouse in any direction.The interaction starts when the user clicks within the zoomed data window. |
The mouse button used to scroll through the displayed data is the right mouse button by default. However, this button can be changed to any other button or key-button combination by passing the corresponding event mask as a parameter to the constructor of the pan interactor, or by means of the
setEventMask method.
The pan action can be performed either on a specific or both axes of a coordinate system. When an interactor instance is created, the panning along the
y-axis is disabled by default. You can change this behavior by means of the
setYPanAllowed and
setXPanAllowed methods.
By default, the cursor used when the mouse is dragged is the predefined
Cursor.MOVE_CURSOR. However, to return another cursor you can override the
getCursor method.
Local reshape interactor
A local reshape interactor has the following characteristics:
Class | |
Registered name | “LocalReshape” |
Default Key or Button | Left mouse button. |
Action | Lets the user reshape the zoomed data window of an IlvLocalZoomAxisTransformer by dragging the zoomed area bounds when the mouse moves over one of the zoomed data window bounds. |
The mouse button used to reshape the data window is the left mouse button by default. However, this button can be changed to any other button or key-button combination, by passing the corresponding event mask as a parameter to the constructor of the pan interactor or by means of the
setEventMask method.
By default, the cursor used when the mouse moves over a zoomed data window bound is the predefined Cursor.HAND_CURSOR. However, to return another cursor you can override the getCursor method.
Local zoom interactor
A local zoom interactor has the following characteristics:
Class | |
Registered name | “LocalZoom” |
Default Key or Button | Left mouse button. |
Action | Lets the user change the zoom factor of an IlvLocalZoomAxisTransformer by dragging a box within the zoomed data window of the transformer. This box indicates the area to be zoomed in or zoomed out. |
The zoom-in interaction is started by pressing the left mouse button by default. However, this button can be to changed to any other button or key-button combination, by passing the corresponding event mask as a parameter to the constructor of the local zoom interactor or by means of the
setZoomInEventMask method.
The zoom-out interaction is started by pressing the Shift Key + left mouse button by default. However, this combination can be changed to any other button or key-button combinations by passing the corresponding event mask as a parameter to the constructor of the zoom interactor or by means of the
setZoomOutEventMask method.
Each zoom-in/zoom-out operation can be broken down into several steps to render a smooth transition between the original and the final visual state of the displayed data. When a zoom interactor instance is created, the default number of steps is set to 10. You can specify the number of steps by means of the
setAnimationStep method.
The cursors used during zoom-in and zoom-out operations can be changed by overriding the
getZoomInCursor and
getZoomOutCursor methods to return another cursor.
Edit-point interactor
An edit-point interactor allows the user to edit a data point. It has the following basic characteristics:
Class | |
Registered name | “EditPoint” |
Default Key or Button | Left mouse button. |
Action | Lets the user modify a data point by dragging its graphical representation within the data display area. |
NOTE The edit-point interactor does not work with 3-D charts. For a list of interactors that work with 3-D charts, see
Available chart interactions.
The mouse button used to perform the edit-point drag operation is the left mouse button by default. However, this button can be changed by passing another button as a parameter to the constructor of the edit-point interactor, or by means of the
setEventMask method.
You can use two modes for the drag operation:
With the opaque mode, the data point is modified each time the mouse is dragged.
With the ghost mode, the data point is modified only when the mouse button is released.
When a drag-point interactor is created, the default mode that is used for the drag operation is the ghost mode. You can specify that the opaque mode should be used by calling the
setOpaqueEdit method with
true as parameter.
The data point modification can be performed either on a specific or both axes of a coordinate system. When an interactor instance is created, editing along the
y-axis is disabled by default. You can change this behavior by means of the
setYEditAllowed and
setXEditAllowed methods with
true as parameter.
During the interaction, the value of the data point that is currently edited can be constrained within some specified rules by means of the
validate method. This method is called each time the mouse is dragged to validate the new data point. For example, the following code shows you how to constrain a data point to have rounded
y-values.
protected void validate(IlvDoublePoints pt,IlvDisplayPoint
dpt) { pt.setY(0, Math.round(pt.getY(0))); }
An example of
IlvChartEditPointInteractor.validate override can be found in
<installdir>/jviews-charts/samples/radar/src/radar/RadarDemo.java. In this example, the
EditPointInteractor class extends
IlvChartEditPointInteractor to provide the following features:
Display the value of the point being edited next to the mouse cursor.
Ensures that the edited points take values that are a multiple of a given precision, by overriding the
validate method.
Highlight-point interactor
A highlight-point interactor triggers an interaction event whenever the mouse moves over a data point in the data display area. It has the following basic characteristics:
Class | |
Registered name | “Highlight” |
Default Key or Button | None. |
Action | Triggers an interaction event whenever the mouse moves over a data point in the data display area. |
To be notified whenever a data point has been highlighted, you have to add an interaction listener on the highlight interactor by means of the
addChartInteractionListener method. Whenever the mouse moves over a data point, the
interactionPerformed method of the listener is called with a
ChartHighlightInteractionEvent as parameter.
The
interactionPerformed method of the listener receives an event, whose
getDisplayPoint method returns:
for all series-based chart types: the point with which it interacts, as an
IlvDisplayPoint instance,
Information-view interactor
An information-view interactor displays information about a data point whenever the user moves the mouse over the data point. It has the following basic characteristics:
Class | |
Registered name | “InfoView” |
Default Key or Button | None. |
Action | Displays information about a data point whenever the user moves the mouse over the data point in the data display area. |
The information is displayed in a
JToolTip instance by default. However, you can change the type of the tooltip by overriding the
createToolTip method to return an instance of your own
JToolTip subclass.
The text that is displayed by default is the name of the data set to which the data point belongs and the abscissa and ordinate values of the data point. This text can be redefined in a subclass by overriding the
getInfoText method.
By default, the text is composed of a description part and a value part. These parts can be customized individually by overriding the
getInfoTextDescriptionPart and
getInfoTextValuePart methods. The argument of these methods is an
IlvDisplayPoint. When used within a treemap, the actual argument will be of type
IlvDisplayObjectArea.
Pick-data-points interactor
A pick-data-points interactor triggers an event when the user selects data points in the data display area. It has the following basic characteristics:
Class | |
Registered name | “Pick” |
Default Key or Button | Left mouse button. |
Action | Triggers an event when the user selects data by clicking a projected point in the data display area. |
The mouse button used to perform the selection is the left mouse button by default. However, this button can be changed to any other button or key-button combination by passing the corresponding event mask as a parameter to the constructor of the selection interactor, or by means of the
setEventMask method.
The mouse event that fires the interaction event is
MOUSE_RELEASED by default. You can change this event by overriding the
isPickingEvent method to return
true when the interaction event should be fired.
To be notified whenever a data point, series or object has been picked, you have to add an interaction listener on the interactor by means of the
addChartInteractionListener method. Whenever the user clicks on or near a data point or data rectangle, the
interactionPerformed method of the listener is called with a
ChartInteractionEvent as parameter. The
getDisplayPoint method returns:
for all series-based chart types: the point that has been clicked, as an
IlvDisplayPoint instance,
Example:
// Create the interactor. IlvChartInteractor
interactor = new IlvChartPickInteractor(); // Determine what to do
when the user performs an action with the // interactor. interactor.addChartInteractionListener(
new ChartInteractionListener() { public void interactionPerformed(ChartInteractionEvent
event) { IlvDisplayPoint point = event.getDisplayPoint();
// In the case of a treemap: // IlvDisplayObjectArea area
= (IlvDisplayObjectArea)point; ... } }); // Activate the
interactor. chart.addInteractor(interactor);
Treemap focus interactor
A treemap chart has the notion of focus. At any time, the treemap displays a subtree of the entire tree of model objects. The root of that branch is called the current focus of the treemap. The focus object is displayed as a rectangle that covers almost the entire surface of the chart area.
The treemap focus interactor allows the user to change the focus. It provides a sort of drill-down. It has the following basic characteristics:
Class | |
Registered name | “Focus” |
Default Key or Button | Left mouse button double-click. |
Action | Changes the treemap focus to the object selected by the user. |
By default, to change the focus you need to double-click with the left mouse button. Different mouse button actions can be obtained by choosing the appropriate constructor of IlvTreemapChartFocusInteractor.
When the focused subtree is not the entire tree, the user has the possibility to come back to the next enclosing focus, the parent object in the tree model, by clicking a border of the chart area that indicates this parent object.
This interactor does not keep a history of the selected focus. You can implement such a history and the appropriate Back and Forward actions by installing a
TreemapFocusListener on the chart.
Copyright © 2018, Rogue Wave Software, Inc. All Rights Reserved.