Customizing a Chart
The complete source code of the examples can be found in the
CustomCartesian.java file for the Cartesian chart and in the
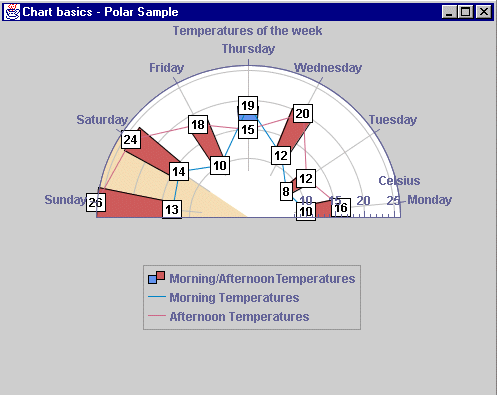
CustomPolar.java file for the Polar charts.
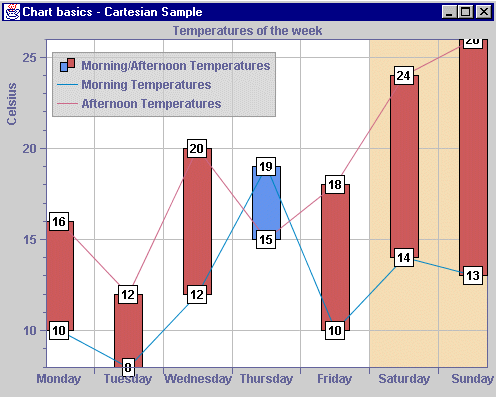
The Temperatures Cartesian Chart with Additional Customizations
3-D Pie Charts
To add a title at the end of the ordinate scale:
1. Set the scale title to "Celsius", with a rotation angle of 90.
The ordinate scale represents the temperatures expressed in degrees Celsius. To indicate the unit of the values represented by this scale, you can add the label "Celsius" at the end of the axis, rotated in the vertical direction.
2. Set its placement value to 80, meaning that the title location corresponds to 80% of the
visible range of the scale (approximately 23):
chart.getYScale(0).setTitle("Celsius", -90);
chart.getYScale(0).getTitle().setPlacement(80);
To add a label displaying the temperature of each data point:

To add a label annotation to the polylines data points, use the following code:
tempRenderer.setDataLabelling(IlvChartRenderer.Y_VALUE_LABEL);
tempRenderer.setAnnotation(new IlvDataLabelAnnotation());
You can add label annotations to every data point of the polylines, so that the corresponding temperature values are displayed over them. In the JViews Charts library, a renderer is annotated by means of classes implementing the
IlvDataAnnotation interface. A data annotation is a graphical annotation that can be either a local annotation, if associated with a data point, or a global annotation if associated with a series or a renderer. The JViews Charts library provides a default implementation to handle label annotations through the
IlvDataLabelAnnotation class. The text displayed by an instance of this class is computed according to the chart renderer labelling mode. This mode specifies the contents of the label associated with a data point: the text can be either a label, the
y-value, the
x-value, or both the
x- and
y-values.
To decorate the chart:

Highlight the week-end period by using a data indicator representing a data interval equal to the week-end period:
IlvDataInterval inter = new IlvDataInterval(chart.getXScale().getStepsDefinition().previousStep(5),
chart.getXScale().getStepsDefinition().incrementStep(6));
IlvDataIndicator weInd = new IlvDataIndicator(-1, inter,null); weInd.setStyle(new
IlvStyle(Color.black, IlvColor.wheat)); chart.addDecoration(weInd);
The JViews Charts package introduces the notion of decoration objects that can be used to add a graphical decoration to a chart. These objects are defined by the
IlvChartDecoration abstract class and are directly handled by the chart itself. A default concrete implementation of this class is provided in the library via the
IlvDataIndicator class to graphically represent different kinds of data values: the
x- or
y-value, an interval along the
x- or
y-axis, or a data window.
To add a title to the chart:

Use a
JLabel instance as the header, initialized with the title text:
JLabel label = new JLabel("Temperatures of
the week", JLabel.CENTER); chart.setHeader(label);
The JViews Charts package provides the
setHeaderText and
setFooterText methods as convenience methods to set header (or footer) labels. These methods internally create a
JLabel instance initialized with the given text and add it to the chart at the corresponding location.
The
IlvChart component can hold two optional
JComponent objects at predefined locations: one at the top of the chart area (the header) and the other at the bottom (the footer). These components can be instances of any
JComponent subclass.
Copyright © 2018, Rogue Wave Software, Inc. All Rights Reserved.

