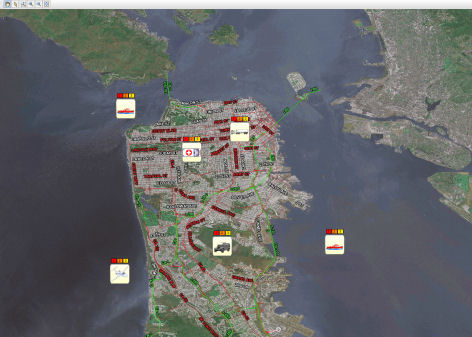
Many monitoring applications need to
visualize monitored assets in their geographic environment and so
need to display interactive and data-driven symbols on top of map
backgrounds.
Most Geographic Information System (GIS)
offerings focus on map creation and distribution and provide poor
performance for zooming and panning. They also lack flexibility in
the visual representation of the background map data, either as
color or when showing data as visible or invisible. For example, it
makes sense to see streets only at a given zoom level and main
roads or motorways only when zooming out.
In addition, GIS offerings do not allow a
rich representation of the data on the map, such as interactive and
automatic updating of symbols when underlying application data
changes. This is a requirement for traffic monitoring and power
grid supervision applications.
A solution to this problem is to choose a
display engine that is not map-specific. Unfortunately, map data
sets can be many gigabytes and specific memory management and
display techniques are needed to provide satisfactory performance
levels.
Rogue Wave® JViews
Maps is the solution to help you deliver such displays. Rogue
Wave JViews Maps
focuses on three major areas:
- Performance together with multithreaded development components, which provide more responsive applications, leave more CPU for other application-intensive tasks, and result in a better end-user experience.
- Flexibility, so that you can easily enrich existing applications or design and build new ones according to your requirements.
- Richness, to minimize your coding work.
Rogue Wave JViews
Maps consists of development libraries and a set of tools that
handle both the map background and the symbology to be placed on
top of it. These symbols are graphic objects that represent the
assets and entities you need to visualize at their given
locations. With Rogue Wave JViews
Maps you can:
- Prepare maps either programmatically or with the map preparation tool. This enables you to import map data and control precisely the look and feel of its representation. You control what you want to see, when and how.
- Create custom interactive and data-driven symbology to represent the monitored assets.
- Efficiently animate the maps and symbols created, with leading-edge performance even on large data sets.
Delivering these displays requires extensive, in-depth knowledge of
both mapping and efficient graphics display. Rogue Wave JViews Maps hides the
complexity of building such displays by handling all the
lower-level "mapping engine" functionality. Java developers can
concentrate on the data they want to display rather than map
formats, projections, efficient management of huge data sets,
overlapping labels, spatial reference systems and so on. As with
all Rogue Wave JViews products, Rogue Wave JViews Maps can be easily
deployed as an application, applet, Java Web Start, or interactive,
AJAX thin client application.
Don't miss these features!
Rogue Wave® JViews
Maps offers a wide range of features to help user interface
developers create state-of-the-art displays. These include:
- The Map Builder, which is a map preparation tool delivered as source code that enables you to jump start your development. It allows you to mix and match raster, elevation, and vector map information, regardless of their parameters.
- Advanced AJAX thin client deployment for RIA applications including Google Maps mash-up capabilities.
- Full support for asset management maps, with custom graphical objects that update themselves efficiently when the underlying data changes.
- A full spectrum of map display capabilities, including the most popular data format readers and writers, geodesic computations such as projections, ellipsoids, and DATUMs, as well as over 1,500 predefined coordinate systems.
- Creation and animation of multilayered and multiscale maps with user-defined visual representations such as color and transparency.
- Contextual grids defined by longitude and latitude or by the MGRS system, with minimized memory and CPU footprint.
- Multiple coordinates and measuring system units.
- Performance features, such as load-on-demand and pixel-on-demand for handling very large data sets, while minimizing the memory footprint.
- Advanced map labeling as well as the standard set of interactions such as panning, zooming, selection, and annotation.
- A set of map data covering the entire world in different resolutions, in both raster and vector formats.