Rogue Wave® JViews Diagrammer is a comprehensive set of design
tools, Java™ components and
libraries for creating graphical editing, visualization,
supervision, and monitoring applications. It allows you to easily
create diagrams, to show the relationships between objects, as well
as dashboards, to monitor business or industrial systems. The
applications are written in Java and can target different
deployment technologies, such as Java-based desktop applications,
Java applets, JSF/Ajax thin clients, or Eclipse™
plug-ins.
Are you new to JViews Diagrammer?
If you are a newcomer to JViews
Diagrammer, this documentation will help you discover the
product. You may want to start with a quick introduction to the
product. Then have a look at the many samples and demos shipped
with the product. Most of them are available as Java applets or
Web applications that you can run and explore directly in your
browser. You may also want to discover the design tools that help
you design dynamic symbols, specify complex model-driven
diagrams, or edit dashboard displays.
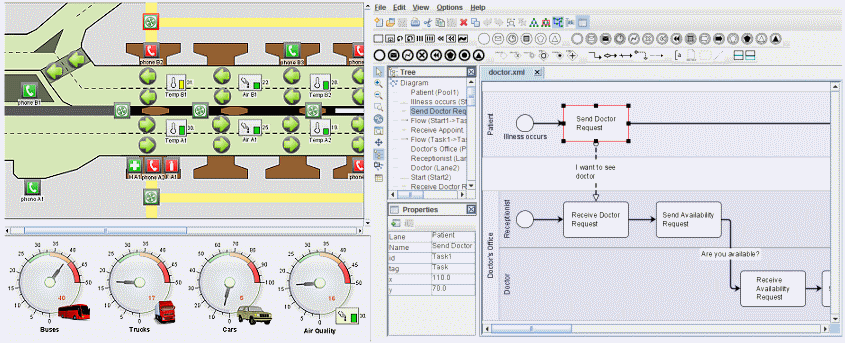
Examples of monitoring and modeling
applications
Don't miss these features!
- Symbol Editor, a point-and-click interface used to create palettes of rich interactive symbols. These symbols combine graphic parts, custom behavior, and interactions. They can be used to populate graphical views of your applications.
- Designer for JViews Diagrammer, a point-and-click editor for specifying most aspects of diagram displays, including the "rules" for defining how the graphics will appear on the screen under different data conditions.
- Dashboard Editor, a point-and-click editor for designing dashboard displays and monitoring panels.
- A full set of graph layout algorithms and link routing techniques to automatically rearrange elements of your diagrams.
- Easy thin-client deployment, based on JSF components and Ajax-enabled DHTML.
- Improved Eclipse integration with SWT controls to manage JViews Diagrammer displays, including diagrams and dashboards.
- The ultimate notation for business processes and Web service choreographies through the full support of BPMN from BPMI.org. It comes with meaningful symbols, the most sophisticated swimlane implementation, support of Data Object and Group artifacts, and flow-validation rules.